2016 Volume Issue 2
Economic Newsletter for the New Millennium
January 19, 2016
For a downloadable version, click the following:
…a bit more compressed version of the PDF
The Employment Gap of 8.4 Million: the Labor Force Participation Rate (LFPR); breaking it down by Age Group
In our last article we noted that while the unemployment rate was 5.0% in December 2015, but there were at least 8 million ‘missing’ from the Labor Force

Employment Gap? What - me, worry?
As we’ve noted on several occasions, going back to May 2010, the Labor Force Participation Rate has been a recurring issue in the employment picture.
May 12, 2010 High/Sticky Unemployment for Years to Come?
www.econnewslettermay122010blog.com/
Here is the break down for the Employment picture for 2015
- 2015 (Annual numbers in thousands (000))
- Civilian Noninstitutional Population 250,801
- Labor Force 157,130 = [(Employed 148,834) + (Unemployed 8,296 ---- actively seeking employment)
- The Labor Force Participation Rate = Labor Force / Civilian Noninstitutional Population
- The Labor Force Participation Rate = 157,130 / 250,801
- The Labor Force Participation Rate = 62.7%
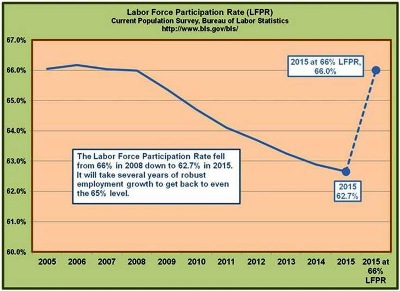
From 2000 through 2008, the Labor Force Participation Rate [Labor Force (Employed + Unemployed actively seeking employment) divided by the Civilian Noninstitutional Population) averaged 66.3%. Again, the Labor Force Participation Rate for 2015 was 62.7%. By simply applying 66.0% to the 2015 Civilian Noninstititutional Population:
- 2015 (Annual numbers in thousands (000)) at 66.0% Labor Force Participation Rate
- Civilian Noninstitutional Population 250,801
- Using Labor Force Participation Rate = 66.0%
- Adjusted Labor Force = (250,801 X 66.0%)
- Adjusted Labor Force = 165,529
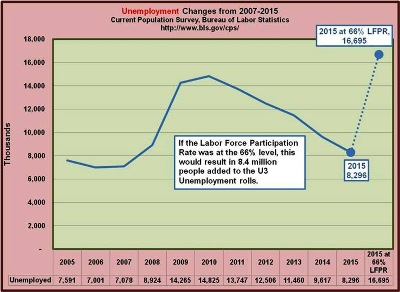
- Adjusted Labor Force 165,529 = [(Employed 148,834) + (Unemployed 8,296 + Adjusted Unemployed of 8,399)
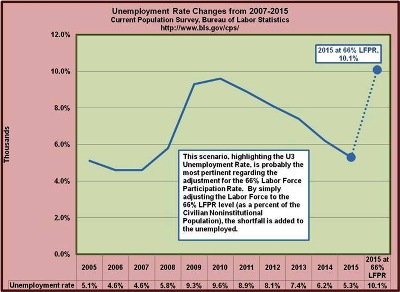
Again, this would equate to an additional 8.4 million unemployed, doubling the Unemployment rate to 10%. That 8.4 million missing from the labor force is what we refer to as the employment gap.
This was covered in greater detail in the last newsletter…
Reviewing the Macroeconomic Indicators through 2015: first up -Labor Markets
www.econnewsletterjan102016.com/
Digging into the details behind the Labor Force Participation Rate Deterioration
The most recurring and somewhat dismissive explanation for the deteriorating Labor Force Participation Rate has to do with the Baby-boomers entering their retirement years (Baby-boom: born 1946-1964). The expectation is that the older age groups will be moving to the sidelines and into the ‘not in the labor force’ component of the Civilian Noninstitutional Population. This is plausible of course, but the reality is quite different.
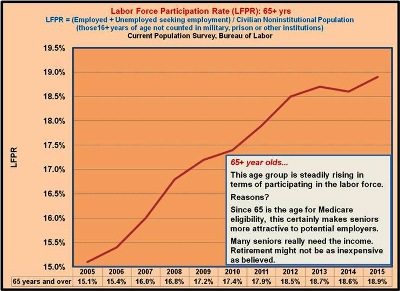
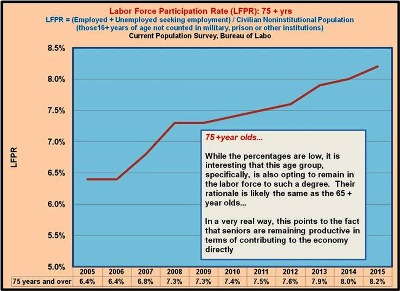
Beginning with the 65+ year-olds…and the 75+ year-olds
While there is a general notion that 65 is some sort of mandatory retirement age, the truth is that many people work well past that age. What is somewhat surprising is that since even before the recession, this age group has been remaining in the labor force at increasing levels. Part of this has to do with people in this age group remaining healthy enough to participate in the labor force. Given the changing nature of the workplace (less physically arduous in many cases), it only makes sense that more experienced employees are an attractive option for employers. There are other considerations including cost of employment (lower cost of health care) and many in this age group are not seeking top wages or even full-time employment since they may already be collecting pensions, Social Security, etc.
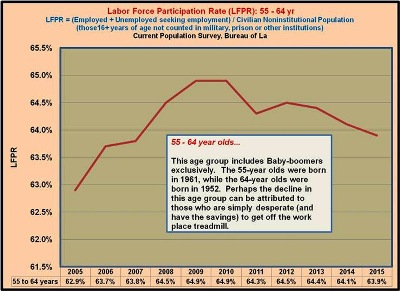
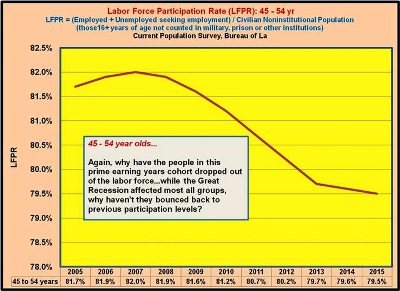
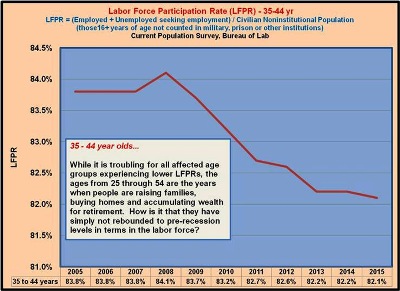
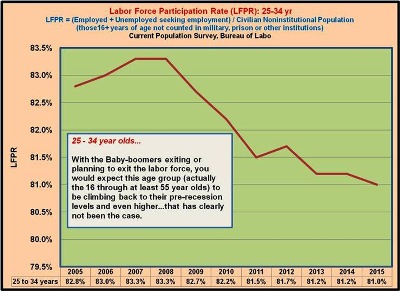
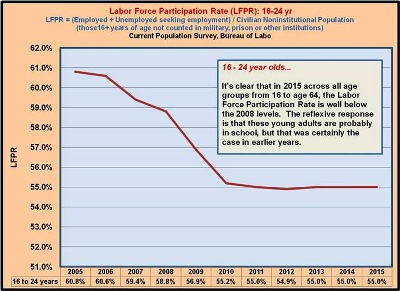
16 - 64 year-olds…
The following graphs have one thing in common: their Labor Force Participation Rate’s for 2015 are lower than their rates in 2008. While the unemployment has fallen significantly, from a peak of 10% in 2009 to 5% in 2015, 8.4 million people remain on the sidelines - not in the labor force.
As evidenced by the last three months of 2015, where the employment expanded by 987,000 and the unemployed fell by only 20,000, it’s apparent that there is ample slack in the labor markets to close that ‘employment gap’ in relatively short order, without much fear of inflation coming from increasing employment. In addition to absorbing the job growth across age cohorts (from 16-64 in particular), the Civilian Noninstitutional Population (CNP) forecast is for continued expansion of around 200,000 per month. Since most of those additions to the CNP typically are at the younger range of the age groups, this will afford even more opportunity to grow jobs without much concern over inflationary pressure.
What we’re really looking at here is an economy that has really failed to recover in an adequate manner from the downturn referred to as the Great Recession.
We will be looking at the economic growth and inflation picture in a subsequent newsletter, but keep in mind as you go through the following graphs that embedded therein are eight million plus individuals who should be in the labor force…