
2016 Volume Issue 9
Economic Newsletter for the New Millennium
October 10, 2016
For a downloadable version, click the following:
…a bit more compressed version of the PDF
WHO REALLY BEARS THE BURDEN OF TAXES?
THE SHIFTING OF TAX BURDENS FROM THE INITIAL TO THE FINAL BEARER OF A TAX BURDEN
How many times in the past year or two have we heard the phrase, ‘soak the rich’, in reference to government taxation and spending. How does government levy taxes that ‘soak the rich’?
For two years I had the privilege of studying under the late Professor Richard A. Musgrave. During that time, he was finishing his classic text, "Theory of Public Finance: A study in public economy." He was an open-minded person and sensitive to each student’s value systems. In his lectures he used rigorous theoretical economic reasoning.
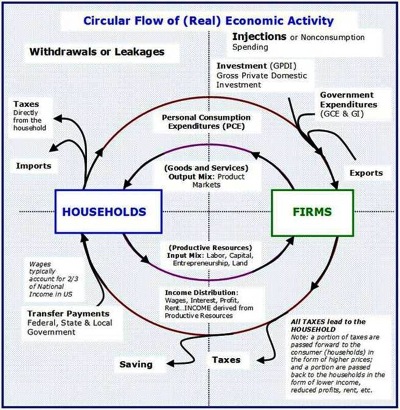
In his text and in his lectures he explained that all taxes, no matter on who the legislation placed the initial burden, were ultimately borne by individuals and only individuals and the households in which they lived. They were borne by individuals either as buyers of goods and services, and/or as productive resources (labor, debt and equity capitalists, entrepreneurs, or land owners). One example he used was the corporate profits tax. Who really finally bore the burden of this tax? No, not the firm - since the firm, business, or corporation is simply the place where production occurs as a result of the firm’s employment of productive resources.
The Circular Flow of Economic Activity
The Impact of Corporate Taxes
Make no mistake, the decisions made for the firm and its owners by the entrepreneurs employed by the firm to make these decisions, are significantly influenced by all costs associated with the firm, including taxes. Consider the impact on the firm as to where production will be located, and how the firm’s product mix will be produced (technology used and thus the productive resource mix). This means that such production as motor vehicles will shift to lower cost locations to such places as non-unionized areas of the U.S. of A resulting in a significant loss of market share of U.S. firms to foreign firms. It also means that domestic firms will gradually move or to lower tax regions such as the Republic of Ireland.
Irish Economy Expanded by 26% in 2015
""I’m not going to stand up and say the economy grew by 26 percent," Power, an independent economist, said after the release. "It’s meaningless -- we would be laughing" if these numbers came out of China, he said.
The figure is mostly explained by the open nature of Ireland’s economy and its attraction to U.S. companies seeking access to a 12.5 percent tax rate. Among firms that have inverted to Ireland, mostly through acquisitions, are Perrigo Co. and Jazz Pharmaceuticals Plc. Corporations with assets overseas of 523 billion euros ($580 billion) were headquartered in Ireland in 2014, up from 391 billion euros in 2013, according to the statistics office."
Who Bears the Ultimate Burden of Taxes - not necessarily those who initially pay them
This is also an important consideration relating to jobs but a different issue than who bears the ultimate incidence or burden of a tax as contrasted with the initial burden or incidence of a tax which is an issue relating to the income distribution leading to legislation attempting to redistribute income.
This newsletter focuses on the income distribution aspect of taxation. Incorrect economic reasoning on the relationship of taxation and the income distribution can cause more harm than good. The phrase ‘enslavement by the welfare state’ comes to mind in this regard.
The ultimate bearers of this tax on a corporate firm’s profits that legislation mandated be paid by the firm is not ultimately borne by the firm but by the buyers of the firm’s products (goods and services) and/or the productive resources employed by the firm to produce the goods and services sold by the firm. The initial incidence of the tax was shifted to either the buyers of the firm’s products and/or to the productive resources employed by the firm to produce its’ goods and services. To the extent that the buyers of the firm’s products, by paying higher prices reflecting the profits tax ultimately bear the tax, it is said to be passed forward. The remaining taxes not passed forward are borne by productive resources employed by the firm, most likely by the owners or equity capitalists and labor.
Note well: If the taxes are borne by the productive resources, they are said to be passed backward. Professor Musgrave believed that a reasonable assumption on the average would be that 1/3 would be finally borne by the buyers (passed forward) and the remaining 2/3 passed backward to the productive resources, 1/3 to labor and 1/3 to the owners (equity capitalists).
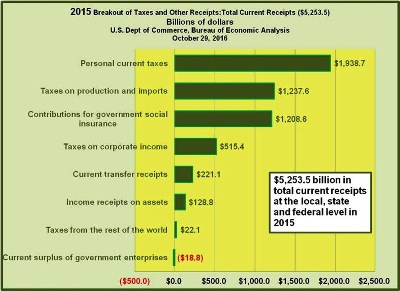
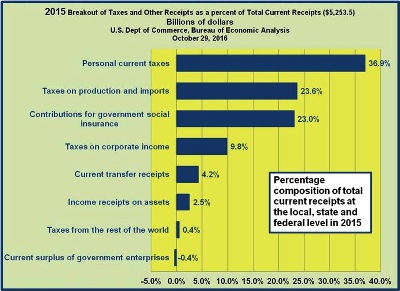
Total current receipts at the local, state and federal level in the U.S. of A. in 2015
It is important to remember that the firm is the place where production occurs and the equity capitalists own the firm but are not the firm! They are but one of the classes of productive resources employed by the firm. While no general rule can be applied to all cases, the actual degree of shifting forward or backward - and if backward, to which resources (labor, capital, entrepreneurship, or land), is determined by respective price elasticities of demand of the buyers of the firm’s products and by the supply of the productive resources employed by the firm to produce its products.
Another error often heard in regard to the corporate profits tax, which is also referred to as the corporate income tax, is that to the degree it falls on the equity capitalist or owners of the firm, it is falling on the rich.
Hold on! We are now in the era of Institutionalism Capitalism and not what I like to refer to as Rockefeller Capitalism. A large and increasing percentage of the common stock of corporations is held or owned by financial institutions such as pension funds, mutual funds, and life insurance companies and a declining percentage over the years by individuals. The majority of beneficiaries of these financial institutions are not the rich (top 5 or 10 or even 20% percent of the income distribution).
www.wsj.com/articles/john-bogle-on-the-future-of-investing-the-rise-of-the-shareholders-1404765274
John Bogle on the Future of Investing: The Rise of the Shareholders
Vanguard's Founder Sees Investors Demanding a Smaller, Simpler Financial System
By John C. Bogle
July 7, 2014 4:34 p.m. ET
The 300 largest institutional money managers—largely mutual funds and pension funds—now own some 65% of all U.S. stocks by market capitalization. (The largest 10 managers alone own 32%.) They therefore hold absolute power over our nation's corporations, a share that is likely to increase over time.
Other taxes such as the income tax and the sales tax have distortive effects on the behavior of buyers and sellers. Over the years studies have shown how higher income and sales taxes can shift buyers and residents from one state, for example, to a city close buy in a bordering state.
I have known neighbors who have moved or established residency requirements in Florida, not only because of its warmer though more humid climate than Michigan, but because of the fact that it has no personal income tax while Michigan does, and it is a fairly hefty one at that.
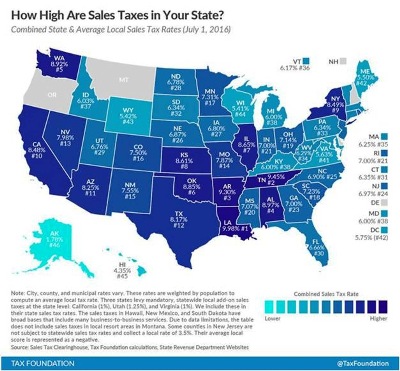
http://taxfoundation.org/article/state-and-local-sales-tax-rates-midyear-2016
As an aside, when a state embarks on a vigorous antipollution campaign; especially with strong enforcement including such things as restrictions and penalties relative to other states, it will usually experience an outflow of businesses and jobs. Most taxes will have similar repercussions.
Since the jurisdiction of the federal government is much more inclusive, such distortive effects on economic activity are significantly less than if undertaken by state and local governments.
To understand more clearly the shifting and incidence of taxes such as the corporate income tax, we will delve a bit more deeply into the concept of price elasticity of demand for a firm’s products and as well as the supply of productive resources such as labor. The next several paragraphs will examine the price elasticity concept briefly. A more in depth analysis of the concept of elasticity will be undertaken in a newsletter article on this website in the near future.
What determines the degree of forward or backward shifting of the tax on a corporation’s profits? As we have earlier indicated, the determinants are the price elasticity of the demand for a firm’s products and the price or compensation elasticity of the supply of a firm’s productive resources employed by the firm.
Price Elasticity and its Significance: who really pays the corporate profits tax?
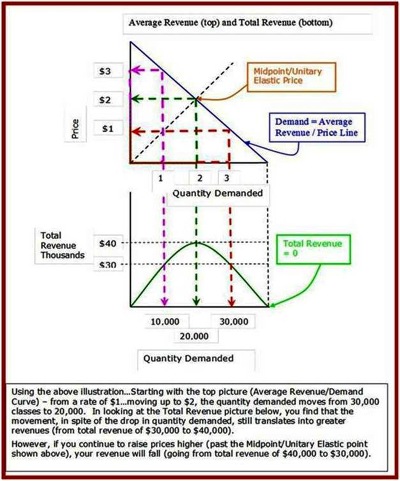
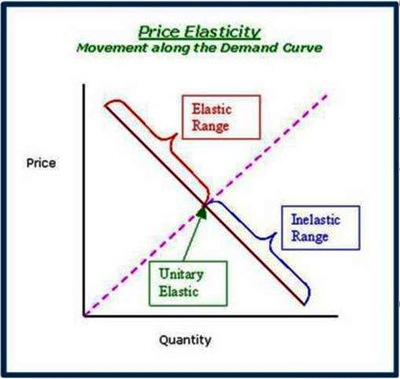
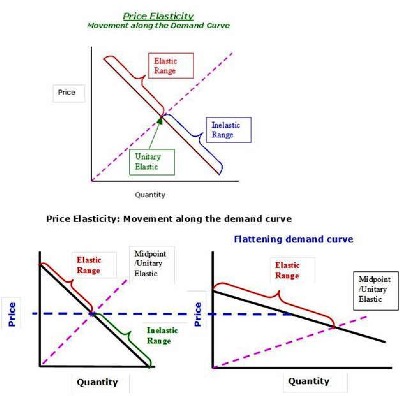
Demand curves facing a firm when it sells its products, exhibit three ranges of price elasticity; relatively elastic above their midpoint, unitary elasticity at their midpoint, and relatively inelastic below their midpoint. The significance of these different ranges is that total revenue (price times quantity demanded) resulting from a firm’s sales increase at a decreasing rate from zero price to the price at the midpoint of the firm’s demand curve and reach a maximum at the midpoint of the firm’s demand curve. As price increases above the midpoint of a firm’s demand curve, total revenue falls with each price increase. We are talking only about total revenue and NOT about costs or profits.
Price Elasticity and Total Revenue
The reason for this behavior of total revenue as price is raised (or lowered) is due to two factors, the substitution and the income effects. Since a future newsletter article will delve into the concepts of elasticity more deeply, we will be brief in this article’s coverage.
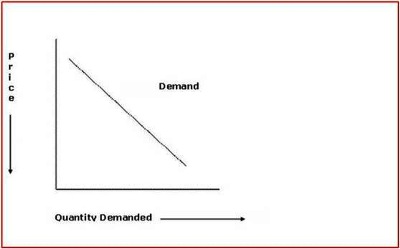
Graphically, nearly all demand curves slope downward to the right as portrayed just below. To keep it simple, we will use a downward sloping linear or straight line demand curve.
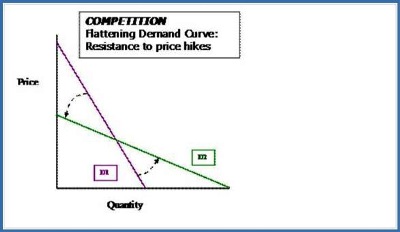
The substitution effect occurs when a firm changes its price. It causes quantity demanded to decrease when price is increased and quantity demanded to increase when the price is decreased. The more substitutes for the good or service in question and the greater their substitutability, the greater the change in quantity demanded for a given change in price and hence the greater is the substitution effect.
The Substitution Effect - flattening the demand curve through competition
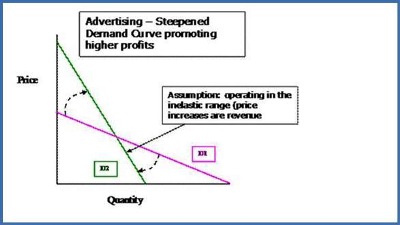
Advertising - steepening the demand curve, lessening the effect of price hikes
Price Elasticity of Demand
www.econnewsletter.priceelasticityofdemand.com/
The relationship of the price to quantity demanded and how it relates to total revenue is technically called the price elasticity of demand.
Technically, the percentage change in quantity demanded divided by the percentage change in the price that caused the change in the quantity demanded
- (QD1 - QD2)/QD1 / (P1 - P2) / P1
The upper portion - above the midpoint (dotted line), is the elastic range where price increase causes revenue to fall.
The lower half and the inelastic range, price increase causes revenue to rise. This is counterintuitive to most people.
Substitution Effect and Income Effect - Shifting Demand
A major reason why firms advertise is to differentiate their product and thus reduce the substitution effect. When such advertising is successful, the reduction in quantity demanded due to a price increase is reduced compared to what it would have fallen by without such advertising. In effect, successful advertising reduces the substitution effect and raises total revenue at each price.
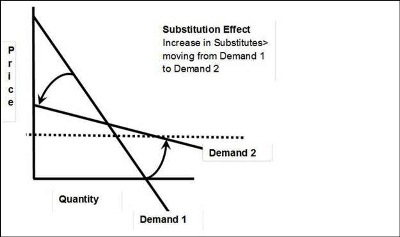
In flattening, the demand curve becomes more price elastic at each price (see figure below: movement from Demand 1 to Demand 2).
As the price increases, the quantity demanded of the good or service in question decreases, and vice versa. The price of a good and its quantity demanded are negatively related. The substitution effect by itself gives a demand curve a downward to the right slope.
The income effect also contributes to the slope of the demand curve but is more complicated to understand than is the substitution effect. First of all, we have to distinguish between three classes of goods and services as they relate to the income of the buyer: normal goods; neutral goods; and inferior goods.
All else equal, if a buyer’s income increases and that buyer increases her quantity demanded of that good or service, the good in question is called a ‘normal good’. Nearly all goods and services are normal goods or services. If in response to an increase in the buyer’s income, that buyer reduces his quantity demanded, it is called an inferior good. Inferior goods are relatively rare. If changes in the buyer’s income have no effect on the buyer’s quantity demanded of the good in question, it is called a neutral good.
So what you ask? For goods and services that are normal, the income effect reinforces the substitution effect. For inferior goods, the income effect works against the substitution effect but is usually swamped by the strength of the substitution effect.
Now you can understand why nearly all demand curves slope downward and to the right. There are a few rare exceptions to this nearly universal rule.
We will briefly discuss two such exceptions, a Giffen good and a Veblen good
- Giffen Goods
- The most famous example of a Giffen good is the potato during the 19th Century in Ireland, then occupied by the British with attribution given to Scottish economist, Sir Robert Giffen, by none other than Alfred Marshall. He noted that as the prices of potatoes rose, the quantity demanded of them increased and not decreased as is the case for most goods and services that are normal. But another vital factor had to be present. In nearly all cases of other goods and services, the substitution effect overwhelms the income effect for nearly all inferior goods. In this case, potatoes constituted the bulk of the budget for the Irish peasants, thus increasing the income effect until it overwhelmed the substitution effect. Voila! Q.E.D. [Quod erat demonstrandum --- which is what had to be shown; that is to say --- I have proved the argument]
- Guess what this does to the noble downward to the right sloping demand curve? For a Giffen good it slopes UPWARD and to the right and looks like a normal supply curve.
- Veblen Goods
- A Veblen good occurs for much different reasons. To see such a good in action, try to find a re-run of the British sitcom ‘Keeping Up Appearances’. Some residents of upscale neighborhoods judge the quality of a product by its price, and as the star of the British sitcom just mentioned, judge the quality of the person by the quantity of pricey product they could afford to buy. I know of one party store owner with his retail outlet in a very upscale neighborhood, who when a certain type of wine is not selling, raises the price, not lowers it, and does so until some ‘….’ buys it. Thanks, Thorstein Veblen, for your contribution to lightening up the ‘ Dismal Science’.
Before you develop a migraine, let’s tie it all together. The stronger are the substitution and the income effects (normal goods) the more horizontal (parallel to the quantity or X axis) is the demand curve facing the firm, the more price elastic will be the demand curve facing the firm that has been legislatively mandated to pay the corporate profits tax. The more price elastic is the demand curve for the firm’s product, the weaker the ability of the firm to pass the burden of the profits tax forward to the buyers of the firm’s products.
Corporate Profits Tax - should we pass it forward to the Consumer, or backward to the Owners of the Productive Resources?
In this case, more of the profits tax will be shifted backward to the productive resources such as labor or equity capitalists. Of course, the more price inelastic is the demand for the firm’s products, the more some of the profits tax will be passed forward to the buyers and they will ultimately bear a portion of the profits tax.
To the extent the firm can’t pass all of the profits tax forward, it will be borne by the productive resources. The more price or compensation elastic is the supply of the non-equity capital productive resources such as labor, the more of the profits tax burden will be borne by the owners, the suppliers of equity capital (the stockholders). To the extent that the supply of a productive resource such as labor is price or compensation inelastic, it will ultimately bear a larger share of the profits tax burden.
The ultimate profits tax burden for the suppliers of debt capital (e.g., bondholders) and equity capital (e.g., stockholders) are somewhat different than those of labor. Equity capitalists, the stockholders (mutual funds, pension funds, etc.), are residual claimants to the profits from the firm’s operations in that they are rewarded from the firm’s operations only if the firm is profitable. Bondholders must be paid a legally promised rate or else a default occurs.
It should also be noted that if rewards from participating in the production process fall below the productive resources opportunity cost, they will tend to leave the firm for employment elsewhere. Similarly, buyers of the firm’s product that for reasons explained above bear portions of the property tax, they may change their product choices over the long run. In the attempt to achieve more equity in the income distribution, the efficiency of the system may be reduced thus reducing the per capita real standard of living.
If a tax such as the corporate profits tax misfires in the attempt to achieve a more equitable income distribution, why not try some other approach, i.e., such as a luxury tax? We did more two decades ago. It was sponsored by Senator Ted Kennedy from Massachusetts. It was on furs, jewelry, and power boats above a certain price for each category. It triggered immediate and growing problems, especially for large power boats whose production was centered in Massachusetts. The problem? Enter our old friend, the substitution effect. Rich people apparently have many relatively close substitutes for new expensive power boats, including repairing and upgrading an older one, trips by plane to places like Costa de Sol and Cancun. New large and expensive power boat sales collapsed and skilled workers began to exit the industry. Within a year or so, Senator Ted led the charge to repeal that tax.
Luxury Taxes - what are the consequences of tax hikes on the wealthy?
http://abcnews.go.com/ThisWeek/story?id=132568&page=1
The luxury tax applied not just to cars, but to jewelry, furs and private planes, and to expensive boats — yachts…
Congress estimated that in 1991 these luxury taxes would rake in $31 million. But the actual sum was just $16.6 million.
Why? Because, to the surprise of no one except tax-raising politicians the luxury taxes caused people to buy less jewelry and fewer expensive cars, planes, and, especially, yachts.
The tax destroyed jobs — an estimated 25,000 of them in the boat-building industry, much of which is in New England — in Sen. Mitchell's Maine and Sen. Kennedy's Massachusetts.
…a bit more recently, in 2010
John Kerry Saves $500,000 By Docking 76-Foot Luxury Yacht Out Of State
www.huffingtonpost.com/2010/07/23/john-kerry-saves-500000-b_n_656985.html
If the "Isabel" were kept at the 2004 Democratic presidential nominee’s summer vacation home on Nantucket, or in Boston Harbor near his city residence, he would be liable for $437,500 in one-time sales tax. He would also have to pay $70,000 in annual excise taxes.
If we can’t address the excessively unequal income distribution when it is ‘earned’ or when it is ‘spent’, then how can society address the problem?
Over the nearly 14 years that this newsletter has been in existence, we have pointed out on numerous occasions, that what would move the economy toward the achievement of the main cause of inequity in the income distribution as well as fuller achievement of the other economic welfare conditions of efficiency, high employment, and a reasonable degree of price level stability would be greater competition. The prime mover to the achievement of the economic welfare goals that free market capitalism is more fully and consistently capable of achieving than any other economic system is COMPETITION in all markets; both the product markets for goods and services and the productive resource markets for labor, capital, land and entrepreneurship.
Competition is the Invisible Hand that Adam Smith in his ‘An Inquiry into Nature and Causes of the Wealth of Nations’ told us would ensure that free market capitalism would bring us the good things as detailed above that constitute the meaning of economic welfare. Yet despite the billions of dollars spent over the years to enforce anti-trust legislation, the agencies assigned the task have failed miserably.
What finally forced down the price of oil and natural gas was not the efforts of the anti-trust agencies, rather it was fracking and in the hands mostly of the independent companies and NOT the ‘Big Five’ oil companies.
LET FREEDOM RING!!! The Shale Gale - July 6, 2012
www.econnewsletterjul062012.com/
"This shale gale, I describe it as the energy equivalent of the Berlin Wall coming down. This is a big deal," says Robin West, chairman and CEO of PFC Energy, who has been in the energy consulting business for decades.
We estimate that by 2020, the U.S. overall will be the largest hydrocarbon producer in the world; bigger than Russia or Saudi Arabia," he says."
U.S. Department of Energy - Energy Information Administration
www.eia.gov/todayinenergy/detail.php?id=26352
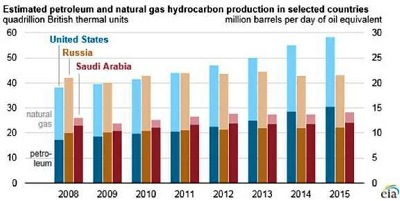
The United States remained the world's top producer of petroleum and natural gas hydrocarbons in 2015, according to U.S. Energy Information Administration estimates. U.S. petroleum and natural gas production first surpassed Russia in 2012, and the United States has been the world's top producer of natural gas since 2011 and the world's top producer of petroleum hydrocarbons since 2013.
