
Economic Newsletter for the New Millennium
2012 Volume Issue 18
July 6, 2012
For a downloadable version, click the following:
…a bit more compressed version of the PDF
LET FREEDOM RING!!!
GOD BLESS AMERICA AND HAIL TO THE SHALE AS IN BAKKEN, EAGLE FORD, MARCELLUS AND ON AND ON AND ON
Dare we celebrate July 4 for two major freedoms? Political independence from the British; and economic independence from the oil tyrants such as OPEC and major U.S. oil giants like ExxonMobil?
We all know about the political freedom won from the British. My children, while searching our family tree, discovered that on my mother’s side, we were part of the early 1600s immigration into New England. In fact, one of the Minutemen killed in the very first fray with the Brits (Battle of Lexington and Concord), was our ancestor.
But this article is about the second freedom, now within our grasp, if we have the political wisdom and will to embrace it. It may sound non-romantic but it is the technological advancement that has given us the ability to tap or rather ‘frack’ the shale rock formations lying five to fifteen thousand feet below the Earth’s surface, for oil and gas. Unless the monopolistically driven large oil and gas firms and cartels are able to control the newer shale oil and gas firms, we are now in the beginning of the Shale Revolution. In a world where terms like ‘plays’ and ‘tight oil’ are becoming commonplace, shale fields or plays such as Bakken, Eagle Ford, and Marcellus are rapidly becoming major sources of oil, gas and related liquids that will give us energy independence. Independence, that is, from the new age Robber Barons controlling oil production, the foreign and domestic major oil companies and their cartel like behavior. Since our growing independence from foreign oil is beginning as a result, the funding for much of terrorism should diminish significantly and we can become more impervious to the ranting and raving of Chavez from his home base in Venezuela.
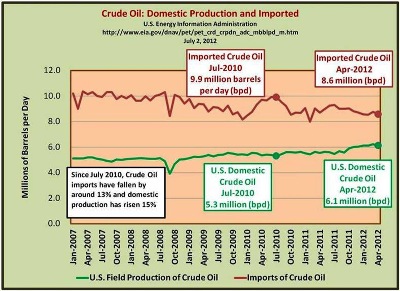
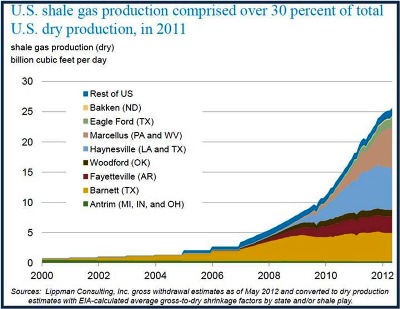
Startling as it may sound, these shale fields are already responsible for 12.5% of domestic oil production and 30% of gas production and have helped to lower crude oil imports by around 13% since July 2010.
www.npr.org/2012/03/07/148036966/is-u-s-energy-independence-finally-within-reach
This shale gale, I describe it as the energy equivalent of the Berlin Wall coming down. This is a big deal," says Robin West, chairman and CEO of PFC Energy, who has been in the energy consulting business for decades.
We estimate that by 2020, the U.S. overall will be the largest hydrocarbon producer in the world; bigger than Russia or Saudi Arabia," he says.
The release goes on to say that tight oil production from the Bakken, Eagle Ford, Permian Basin, and others now account for 12.5% of U.S. production, production which is - after decades of decline in the U.S. - now steadily rising.
Tight oil and gas along with shale oil and gas are terms used to distinguish oil and gas extraction from shale using horizontal drilling and fracking technique from the traditional vertical wells drilled into pool-like reservoirs.
www.shell.us/home/content/usa/aboutshell/shell_businesses/onshore/shale_tight/
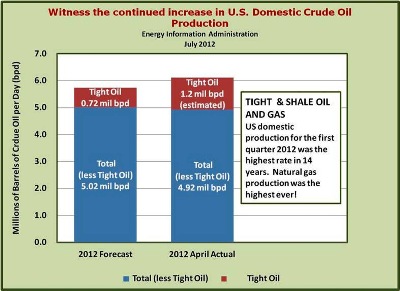
The total domestic (U.S.) production level in the Energy Information Administration 2012 Energy Outlook for crude oil production in 2012 was forecast at 5.74 million barrels per day (bpd); of that, tight oil production was 720,000 bpd which equates to a12.5% share of the total. Keep in mind that modern fracking (tight oil and shale oil extraction via horizontal drilling) only began in earnest over the past few years.
Again, according to EIA data, the actual production for April 2012 was 6.12 million bpd and virtually all of the increase is attributable to tight oil from plays like Bakken (actual 609,371 bpd April 2012) and Eagle Ford (actual 520,000 bpd April 2012). This would push the tight oil share of the total up to around 18%. The EIA Annual Outlook did not have domestic crude oil production passing 6.0 million until 2015.
Energy Information Administration June 8, 2012 – Today in Energy
http://205.254.135.7/todayinenergy/detail.cfm?id=6610
After remaining steady between 5.5 million and 5.6 million bbl/d during each of the first three quarters of 2011, EIA estimates that U.S. average quarterly oil production grew to over 5.9 million bbl/d during the fourth quarter and then surpassed 6 million bbl/d during the first quarter of 2012, according to the latest output estimates from EIA's May Petroleum Supply Monthly report (see chart below). The last time U.S. quarterly oil production was above 6 million bbl/d was during October-December 1998.
Gas Drilling Slows, Heating Up Prices
May 3, 2012
http://online.wsj.com/article/SB10001424052702303877604577380470571678552.html
Energy producers are showing the first significant signs of scaling back their natural-gas output, responding to a glut that has driven prices to the lowest level in more than a decade.
Exxon Mobil Corp., Encana Corp. and ConocoPhillips, among the country's largest natural gas producers, said in recent days they reduced production in the first quarter and pledged to reduce drilling further in coming months.
Just as Thomas Paine wrote his fiery essay “Common Sense” to spark our fight for political independence, so the Sage of Kirkcaldy, Adam Smith gave us his “Wealth of Nations” to spark our economic independence from mercantilism still dominated by the fading shadow of feudalism.
The picture developing from the shale production marks the beginning of a revolution of energy independence that was launched with the invention and promulgation of ‘fracking’ technology and the discovery of large and numerous shale formations. The rest of this article will probe the economic analysis of oil price determination from both the macroeconomic and microeconomic perspectives as it applies primarily to the rapidly changing market for crude oil.
Have no fear, we will keep you informed of the Shale Revolution as it unfolds.
NOW TO THE BASICS…
A LESSON FROM ADAM SMITH AND HIS WEALTH OF NATIONS
If you ask the question, what determines prices, most people, even those who have never studied economics, would answer, supply and demand. While this is correct, what is just as, if not more important, is the answer to the question, how much competition among suppliers and demanders exists in a particular market? Adam Smith in his Wealth of Nations, referred to competition as an Invisible Hand.
Income Distribution and its Relationship to Competition…
April 26, 2012
www.econnewsletterapr262012.com/
One of the most famous terms he coined by Adam Smith, was the “INVISIBLE HAND”. He was referring to vigorous competition in markets. He only used it a few times (once in Wealth of Nations) but it is central to his support of free market capitalism. In effect he was saying, do your damndest to maximize your self-interest, but if the Invisible Hand of vigorous competition is present in the market, your self-interest will also lead toward a maximization of the common good.
Of course, absent the Invisible Hand, all bets are off. In that case he explained that,
People of the same trade seldom meet together, even for merriment and diversion, but the conversation ends in a conspiracy against the public, or in some contrivance to raise prices.
Adam Smith – An Inquiry into the Nature and Causes of the Wealth of Nations
www.econlib.org/library/Enc/Cartels.html
Michael Forsyth MP (British) Adam Smith's Relevance for Today
www.adamsmith.org/sites/default/files/resources/adam-smith-relevance.pdf
For [Adam] Smith, government should not seek to subvert the creative process that is the market, but should establish the framework necessary to keep it alive. It should enforce competition. It should not give in to the well-argued demands of monopolists and would-be monopolists. It should punish people and authorities who conspire to fix prices, divide up markets, or restrict production. "Monopoly," wrote Smith, "is a great enemy to good management.
From a macroeconomic perspective, the high price of fuel is one of the deterrents to economic recovery and also the source of funding of much of the terrorism throughout the world.
The NYMEX (New York Mercantile Exchange) price for one barrel of light sweet crude oil (WTI – West Texas Intermediate) was around $88.00 on July 3, 2012 (www.dailyfinance.com/quote/nymex/light-sweet-crude-oil-futures/~cl) and Brent Crude was around $100 per barrel.
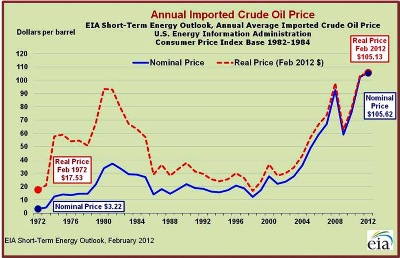
Back in 1972, before OPEC seized control of the production and pricing decisions over the concessions licensed to the Seven Sister’s, the price of an imported barrel of oil was $3.22 (in today’s U.S. dollars that would be $17.70).
http://data.bls.gov/cgi-bin/cpicalc.pl?cost1=3.22&year1=1972&year2=2012
What happened over the past forty years and why so?
- Theoretical Welfare Economics
- If competition is vigorous on both sides of the market, as explained in earlier articles on this web site, the theoretical economic welfare conditions are closely approached. These economic welfare conditions from the microeconomic perspective are equity and efficiency. From the macroeconomic perspective, they are high employment (natural rate of employment meaning that the labor markets are cleared) and a reasonable degree of price level stability, the limiting case being very mild deflation.
The Income Distribution and its Relationship to Competition from the Perspective of Theoretical Welfare Economics
April 26, 2012
www.econnewsletterapr262012.com/
Theoretical Economic Welfare Conditions
The effects of this increase in competition bring the income distribution closer to the theoretical economic welfare condition of equity -- consumers pay the lowest price possible consistent with the reward to resources equal to their opportunity cost -- and thus to conformity with commutative justice. It simultaneously causes the market price to approach the theoretical economic welfare condition of efficiency.
As the distribution of income is more closely based on opportunity costs of the productive resources such as labor and capital, the closer is the economic system to conformity with distributive justice. This in turn reduces the need for government to reallocate income.
- Efficiency
- Efficiency means that the per capita standard of living is at a maximum given the stock of resources, technology, etc. The consumer is able to purchase the greatest quantity of goods and services at the lowest possible price, thus maximizing the real purchasing power of their income. This can be viewed as the consumer’s income having the most ‘bang’ for the buck. Technically, one condition achieved when efficiency exists is that the price equals marginal opportunity costs.
- Equity
- Equity means that the consumer surplus is at a maximum subject to the constraint that all productive resources are receiving a reward or income just bit higher than their opportunity cost, no more and no less. There is no producer surplus (no ‘economic rent’ nor surplus rewards to capitalists, labor nor entrepreneurs). This is what keeps you working at your current job. You are compensated just enough to keep you from leaving for greener pastures.
A Macroeconomic Perspective
As competition increases, the economy moves toward the widely desired goals of high employment and a reasonable degree of price level stability. As these goals are approached, the need for government intervention through monetary and fiscal policies is reduced significantly.
When markets lack significant competition, prices tend to be rigid downward. In pursuit of profit maximization, when demand weakens, in order to reduce market surpluses and rising unwanted inventories, firms tend to reduce output by a greater amount than if the market in which they sell their products were more competitive.
Pursuant to profit maximization, there is usually little reluctance to raise price when the demand they face increases causing a shortage at the prevailing price. This lack of competition introduces a downward rigidity in pricing giving rise to twin biases toward both recession and inflation.
As markets become increasingly competitive the downward price rigidity weakens as firms lose market power and control over price. Competitive pressures force the price downward and as a result, the economy more closely approaches the macroeconomic goals of high employment and a reasonable degree of price level stability. The fall in the price reduces the decrease in quantity supplied needed to restore equilibrium in the market. This reduces the need for government intervention to achieve the widely accepted goals of high employment and a reasonable degree of price level stability.
Most of the polls taken over the years verify that the majority of the adult U.S. population is center-right on economic issues, i.e., they support free market capitalism as long as it is NOT dominated by big business. They seem to understand intuitively the benefit to society of free market capitalism and the damage done to markets and their economic welfare when big businesses dominate product markets for goods and services or when powerful unions dominate the labor markets. They are correct or ‘spot on’ as the Brits say.
Some markets lack vigorous competition because the technology available and the relative size of the market cause them to be “natural” monopolies or “natural” oligopolies. The natural monopolies are often designated public utilities and are often regulated at to the prices they can charge, such as your local electric companies or before its breakup, Ma Bell. The natural oligopolies are more problematic and would include the producers of autos and airplanes.
Let’s analyze the crude oil market which is dominated by big oil firms, most of whom are organized formally or informally into a cartel. Such market structures are classified as ‘natural oligopolies. In markets so structured, firms, especially when they act in concert with other firms, have what is referred to as market or monopoly power. What this means is that the firm or the cartel can influence the price by altering the quantity it or they supply.
As markets become less competitive, the outcomes move away from the optimal economic welfare conditions of equity, efficiency, high employment, and a reasonable degree of price level stability.
There are some other markets beset by imperfections such as not being able to exclude the non-payers from benefitting from what is produced, but we have discussed these cases in other articles on this website.
Market Imperfections and the Discernment Process
The crude oil market has been dominated by large firms some of which have aligned themselves into cartels such as OPEC. The U.S. segment became much more concentrated in the period from roughly 1993 to 2003 as firms merged, including Exxon-Mobil merger.
They are not formally part of the OPEC cartel but effectively are such since they proclaimed that they would accept the market determined pries which of course are heavily influenced by OPEC.
U.S. Energy Information Administration
www.eia.gov/pub/oil_gas/petroleum/analysis_publications/chronology/petroleumchronology2000.htm
The role of mergers and acquisitions dramatically changed the composition of the U.S. major energy companies during the 1990's. The number of major U.S. energy companies dropped from 19 in 1990 to 10 in 2000. With the 2001 merger between Chevron and Texaco, the number of major U.S. energy companies was reduced to less than half of those operating in 1990. Notably, the merger between Exxon and Mobil created the world’s largest publicly traded energy company.
High Gas Prices – Recipe for Killing an Economic Recovery
March 27, 2012
www.econnewslettermar272012.com/
1990s --- MERGER MANIA --- higher prices today
Some of the arguments for consolidation included the desire to increase efficiencies and provide petroleum products at lower cost to the consumer…sure thing
- 1997 Ashland Oil combines most assets with Marathon Oil
- 1998 British Petroleum (BP) acquires Amoco
- 1998 Pennzoil merges with Quaker State Oil
- 1999 Exxon and Mobil join to form Exxon Mobil
- 2000 British Petroleum (BP) acquires ARCO (Atlantic Richfield)
- 2001 Chevron acquires Texaco to form Chevron Texaco
- 2002 Conoco merges with Phillips
- 2002 Royal Dutch Shell acquires Pennzoil-Quaker State
From May 2005
The Nature and Possible Solutions to the Current Energy Challenge
www.econnewslettermay312005.com/
From 1991 through 2000, there were over 2,600 mergers in the petroleum industry. The largest of these mergers included Mobil and Exxon, the two biggest domestic oil companies at the time. As noted previously, the top three firms went from having about 20% market share to 30% market share. To put this in perspective, in the U.S. auto industry, the Big Three had over 90% of the domestic market share after WWII. Today, that same three have between 50 and 60% [around 45% of the U.S. domestic market in the first quarter 2012].
Federal Trade Commission
March 2007
www.ftc.gov/bcp/workshops/energymarkets/background/slocum_oilgas.pdf
Recent Mergers, Weak Anti-Trust Law Threaten Consumers
In just the last few years, mergers between giant oil companies—such as Exxon and Mobil, Chevron and Texaco, Conoco and Phillips—have resulted in just a few companies controlling a significant amount of America’s gasoline, squelching competition. In 1993, the largest five oil refiners controlled one-third of the American market, while the largest 10 had 55.6 percent. By 2005, as a result of all the mergers, the largest five now control 55 percent of the market, and the largest 10 dominate 81.4 percent. This concentration has led to skyrocketing profit margins.
Bring on the Shale (Gale) Revolution!
