
2019 Volume Issue 1
March 8, 2019
For a downloadable version, click the following:
…a bit more compressed version of the PDF
What is Really Going on with the Falling Unemployment Rate?
Does the current four percent U3 unemployment rate, constitute a justifiable reason for the FED (Federal Reserve System --- Federal Open Market Committee) to drive up the targeted Federal Funds Rate?
U3 Unemployment Rate on the Rise?
In the recently published monthly labor situation as reported by the U.S. Department of Labor, Bureau of Labor Statistics (BLS), the U3 Unemployment Rate rose to 4.0% from a low of 3.7% in November 2018. Keep in mind that the U3 Unemployment Rate equals those Unemployed [(1) not employed; (2) actively seeking employment)] divided by the Labor Force (Unemployed + Employed). The rising U3 Unemployment Rate has been triggered by additional people re-entering the labor force due a continued rise in available jobs. We've truly arrived at a point with the labor markets where opportunities are becoming much more plentiful. Further increases in the unemployment rate going forward only serves to reinforce the Encouraged Worker Effect.
Are We Really in Full Employment Territory? What are the Consequences?
Conventional wisdom and historic observation would indicate to us that our current 4.0% U3 Unemployment rate is at or even below the traditional 'full employment rate' which generally falls into the 5.0% to 4.0% range. To put a finer point on it, the current 4.0% is much lower than the average unemployment rate over the last 50 years. This low unemployment rate has provided cover for the Federal Open Market Committee to drive up the targeted Fed Funds rate (raising the effective Fed Funds rate 'administratively', in de facto sense). Fearing wage inflation pressure (cost push inflation), the FED has been preemptively driving up interest rates through the actions of the Federal Open Market Committee, exercising their monetary policy authority.
This also supports the argument for increased immigration; pointing to a diminishing supply of available labor. The fact is that while increased immigration can certainly address the supply issues, are we really moving into that full employment range that begs for increased amounts of imported labor? Is the prospect of significant tightening in labor markets, prompting wage inflation really to the point where FED actions to drive up interest rates are called for? The answers to these questions/concerns are fairly straightforward: one only need look under the hood of the Labor Force Participation Rate where several million potential additions to the labor force are still on the sidelines.
Are we in the range of full employment? The current U3 unemployment rate is 4.0% - January 2019
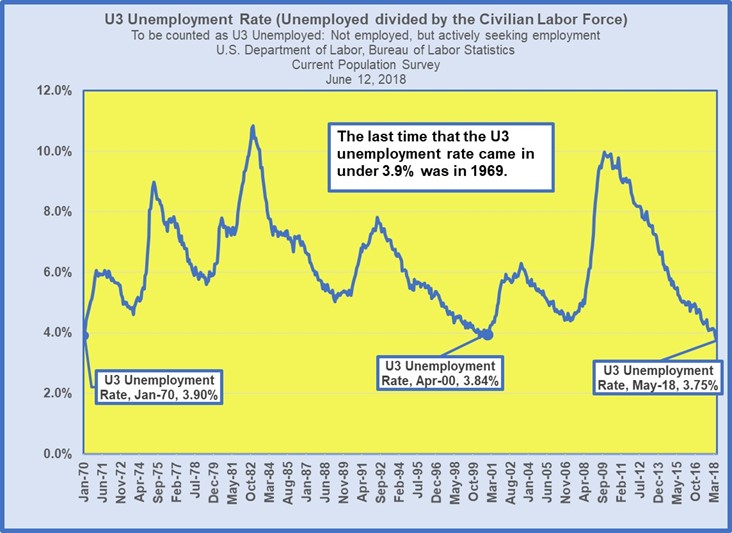
In most cases, such a plunge in the unemployment rate would be cause for celebration, so what is going on behind the scenes that might call that into question?
We've been talking about the Labor Force Participation Rate since 2012 - Why?
May 12, 2010
Is Full Employment No Longer A Realistic Goal for this Decade?
Labor Force Participation Rate
(Civilian Labor Force /Civilian Noninstitutional Population)
The Labor Force Participation rate has been in the 66.0% range for the past several years prior to the end of 2008.
April 2010
Labor Force Participation Rate: Labor Force / Civilian Noninstitutional Population 65.2%
May 8, 2012
The Civilian Labor Force Participation (LFPR) and its Continued Impact on the Employment Situation
The Labor Force Participation Rate fell from 63.8% in March 2012 to 63.6% in April 2012. Simply put, a continued shrinking labor force does not bode well for the economy. Without an expanding labor force, it is impossible for the economy to grow sufficiently, it is impossible to provide a framework for an equitable income distribution, and it is impossible to provide tax revenue to even sustain current government programs at the local, state and federal level.
http://econnewsletter.com/2012/mar092012.html
Unemployment and Employment are subsets of the Labor Force; Civilian Noninstitutional Population includes the Labor Force and those '16 and over' who are not in the Labor Force.
Fast Forward to January 2019
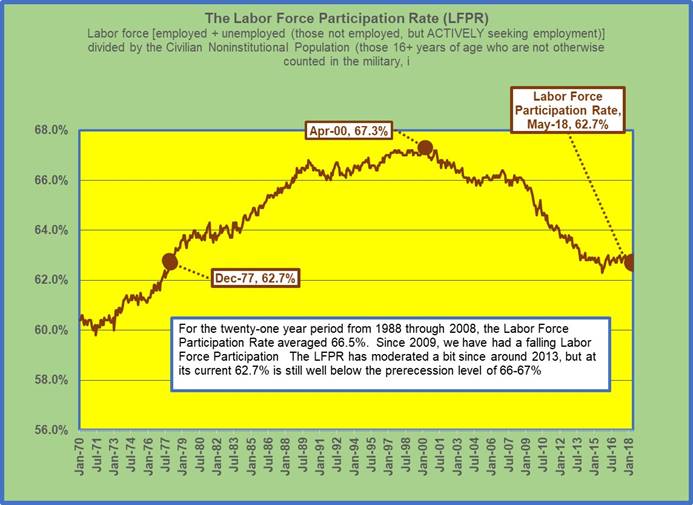
The Labor Force Participation Rate is simply equal to the labor force [employed + unemployed (those not employed, but ACTIVELY seeking employment)] divided by the Civilian Noninstitutional Population (those 16+ years of age who are not otherwise counted in the military, incarcerated, or in other institutional settings). The major conventional point of contention is that this counts those older age cohorts (groups) who are retired.
The current Labor Force Participation Rate came in 63.2% in January 2019. For the twenty-one-year period from 1988 through 2008, the Labor Force Participation Rate averaged 66.5%.
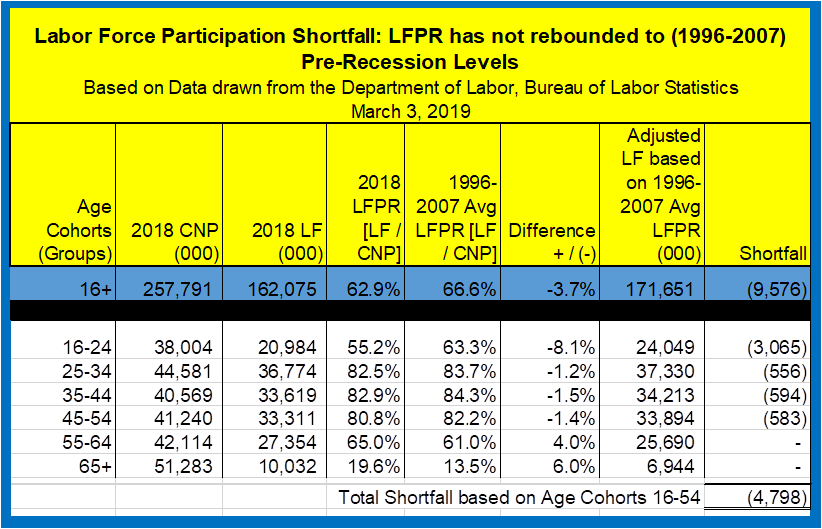
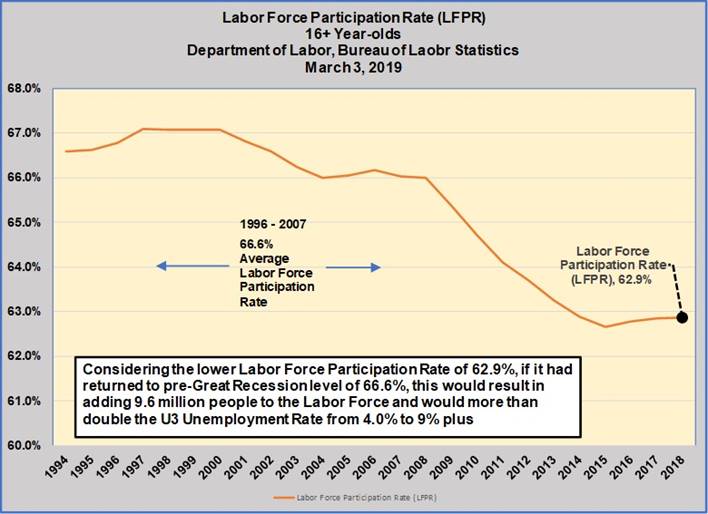
Adjusting the current Labor Force to reflect that 66.5% provides us with a bit more insight into what is happening in the labor markets; especially regarding that U3 unemployment rate, which registered 4.0% in January. The current labor force is 163.2 million (155.8 million employed and 6.3 million (U3) unemployed). The current Civilian Noninstitutional Population is 257.8 million (those 16+ years old, not in the military, nor otherwise counted in institutions by the Census Bureau). Again, the Labor Force Participation Rate is derived from the Labor Force (LF) 162.1 million, divided by the Civilian Noninstitutional Population (CNP) 258.2 million, totaling 63.2%.
66.6% of the current CNP equals 171.7 million, meaning that there is a shortfall of 9.6 million people in the labor force (employed + unemployed). Since 9.6 million people are not employed, but also NOT actively seeking employment, they are not included in the labor force. On the one hand, if those 9.6 million people were added to the unemployment rolls, that would drive the unemployment rate up to the 9% range. Of course, the counter argument is that that 8.5 million number should certainly be lower based on the large number of Baby Boomers (born 1946 to 1964) leaving the labor force altogether. Let's delve into that a bit further.
What does all of this mean? A five-year window - continued job growth?
How could we possibly add 12 million people to the labor force in five years?
Drilling down on that 9.6 million number, let's just say that only around half of those people, or 4.8 million people could reasonably be absorbed back into the economy, consisting of those people ages 16-54. So, let's look this absorption process over a reasonable period of time. The current monthly additions to the Civilian Noninstitutional Population (CNP - 16+ years of age, not in the military, nor otherwise counted in institutions) is in the 185,000 range (180,000 to 200,000).
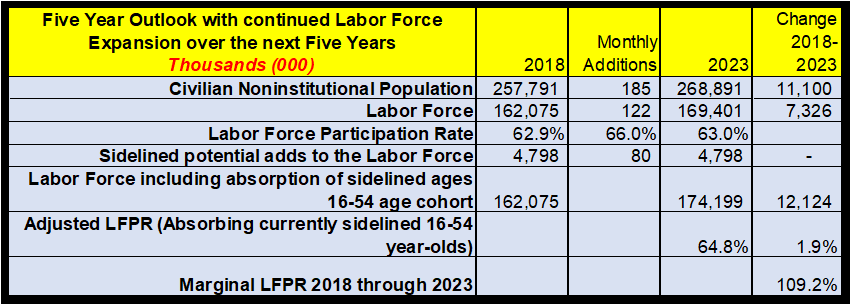
Assuming that those additions to the Civilian Noninstitutional Population are absorbed into the workforce at a 66% rate, that amounts to 122,000 additions to the labor force per month. In addition, if you add 78,000 per month from the 4.8 million on the sideline, outside of the labor force; folding them back in, this amounts to 200,000 new jobs added to the economy per month - but for how long? By simply dividing the 4.7 million by the 78,000 potential monthly additions it would take five years to completely absorb the new entrants into the labor force. Even with this marginal 108% monthly Labor Force Participation Rate (LF/CNP) over the next 60 months, this would only get us back to just under the 65% Labor Force Participation Rate range by the year 2024. The silver lining is that this should really make it quite clear that there is ample room for continued job growth, matching up well with continued expansion of the economy. 7
Conclusion - where do we go from here?
The reality is that there is ample room for continued growth in the labor markets. By adding 12 million bodies to Labor Force over the next five years, this will go a long way in terms insuring income security for the younger age cohorts and adding to tax collection at the local, state, and federal level. With any luck, the growing workforce will the push the date of insolvency in the Social Security Trust Fund back a few more years. The driver behind this continued expansion of the labor market is a growing and vibrant economy. Fears of inflation driven by 'too strong' labor markets should be allayed a bit by the continued expansion of the labor force, triggered by increasing participation rates, especially in the younger age groups. As an aside, it should be clear that higher participation rates for 55+ year-olds will only serve to help maintain economic expansion. These higher participation in the older segment of the population includes people with many years of experience and there's no reason why that age group shouldn't continue to remain productive members of society if they so choose.
While the FED has been banging the drum for increasing the FED Funds target rate for at least the last 24 months, they seem to have been backing off of late. Perhaps they recognize the fact that there is still ample room for growth in the labor markets. Inflation fears have also been dampened by lower energy prices. When OPEC threatens to drive up crude oil prices, domestic producers in the US respond with increased production. This added layer of competition in the energy sector should keep a lid on future price increases.
While immigration continues to be an important component for the health our labor markets, it should be clear that our domestic supply of labor is more than sufficient to meet demand for the foreseeable future.
We will discuss concerns over the prospects for future economic growth going forward.
The following material provides a bit more details on the various age cohorts and the challenges facing those groups going forward. It is clear that the 16-54-year-old groups should be participating at a much higher rate than was even the case leading up to the Great Recession in 2007. In short, they have a lot of ground to make up for.
What is going on with the various age groups (cohorts)?
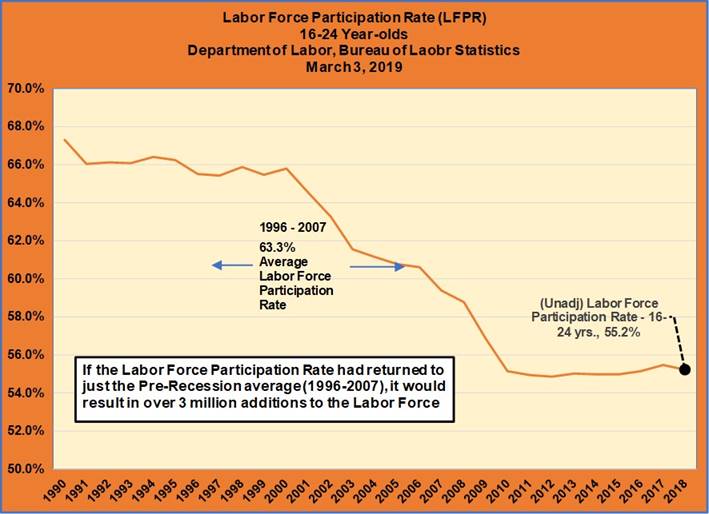
Age Cohort: 16 - 24
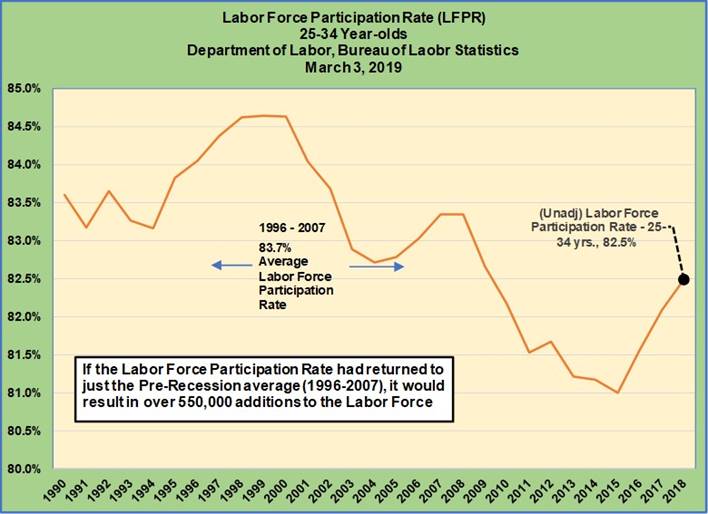
Age Cohort: 25-34
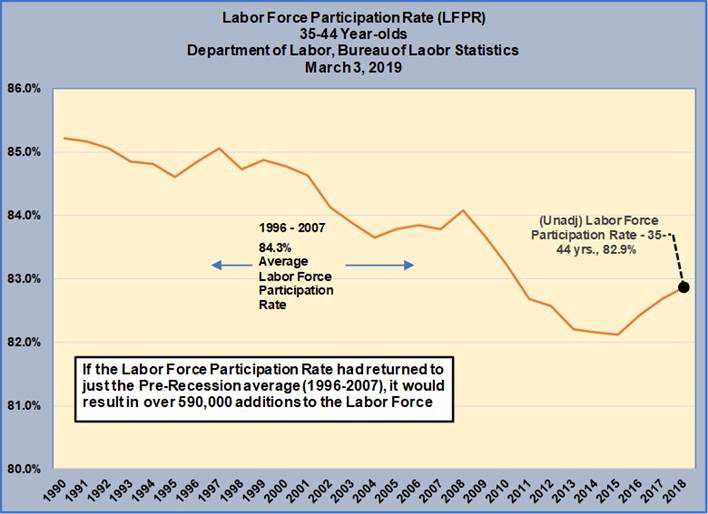
Age Cohort: 35-44
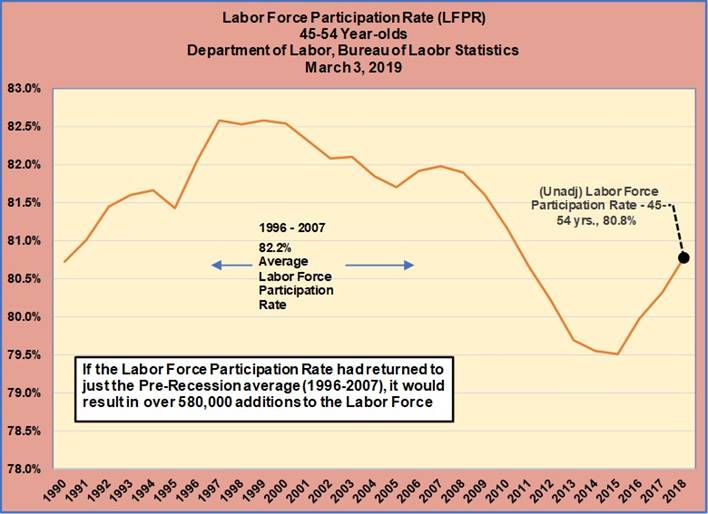
Age Cohort: 45-54
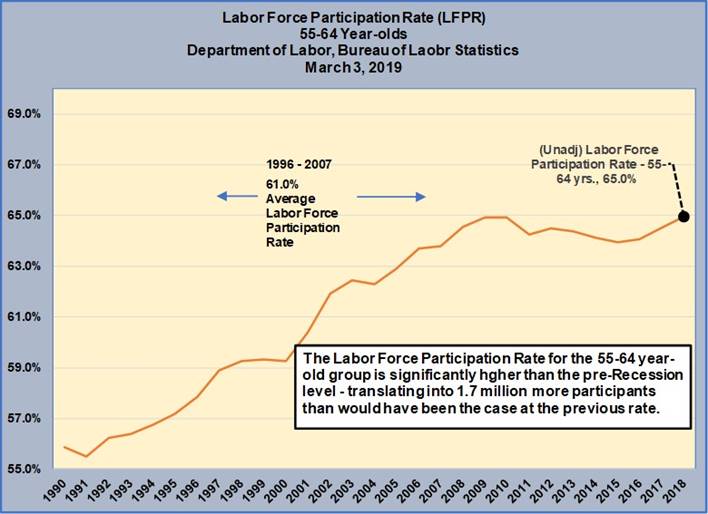
Age Cohort: 55-64
Age Cohort: 65+

