The article “Quick Look at the Price of Oil, Gas, and Effect on Consumer Income” presents a comparative analysis of retail gasoline prices under different scenarios. It highlights how fluctuations in crude oil costs, crack spreads, and taxes influence the final price consumers pay at the pump.
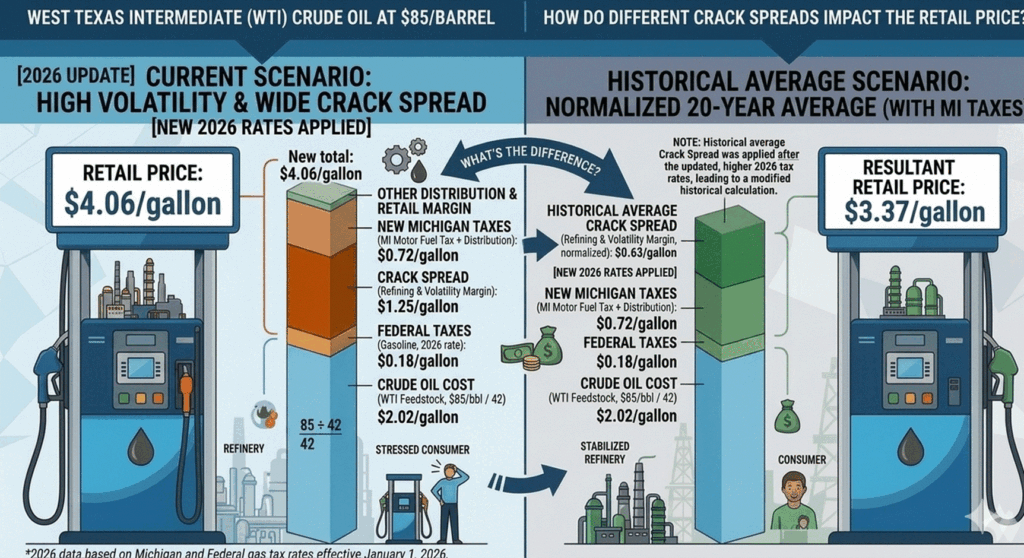
The current scenario, with West Texas Intermediate (WTI) crude oil at 4.06 per gallon. This price is broken down into various components: $0.72 for distribution and retail margin, $1.25 for the crack spread, $0.18 for federal taxes, and $2.02 for the crude oil cost. The “Stressed Consumer” graphic visually represents this higher price point.
In contrast, the historical average scenario, normalized over 20 years and including Michigan taxes, shows a significantly lower retail price of $3.37 per gallon. This scenario assumes a narrower crack spread and potentially different tax structures or crude oil costs. The breakdown reveals $0.72 for distribution and retail margin, a lower crack spread (implied by the overall lower price), $0.18 for federal taxes, and $2.02 for crude oil cost.
The article effectively illustrates the impact of the crack spread, which represents the difference between the cost of crude oil and the price of refined petroleum products, on the retail price of gasoline. A wider crack spread, as seen in the current scenario, directly contributes to a higher consumer price, even when other factors like federal taxes remain constant. This analysis is crucial for understanding the complex dynamics of the energy market and its direct effect on household budgets. The visual representation aids in quickly grasping the cost breakdown and the significant difference in retail prices between the two scenarios. When this spread widens, it serves as a key indicator of refining profitability, yet it directly burdens the end consumer with higher pump prices.

 1

 Income and Wealth Distribution

The article “Quick Look at the Price of Oil, Gas, and Effect on Consumer Income” presents a comparative analysis of retail gasoline prices under different scenarios. It highlights how fluctuations in crude oil costs, crack spreads, and taxes influence the final price consumers pay at the pump.
The current scenario, with West Texas Intermediate (WTI) crude oil at 4.06 per gallon. This price is broken down into various components: $0.72 for distribution and retail margin, $1.25 for the crack spread, $0.18 for federal taxes, and $2.02 for the crude oil cost. The “Stressed Consumer” graphic visually represents this higher price point.
In contrast, the historical average scenario, normalized over 20 years and including Michigan taxes, shows a significantly lower retail price of $3.37 per gallon. This scenario assumes a narrower crack spread and potentially different tax structures or crude oil costs. The breakdown reveals $0.72 for distribution and retail margin, a lower crack spread (implied by the overall lower price), $0.18 for federal taxes, and $2.02 for crude oil cost.
The article effectively illustrates the impact of the crack spread, which represents the difference between the cost of crude oil and the price of refined petroleum products, on the retail price of gasoline. A wider crack spread, as seen in the current scenario, directly contributes to a higher consumer price, even when other factors like federal taxes remain constant. This analysis is crucial for understanding the complex dynamics of the energy market and its direct effect on household budgets. The visual representation aids in quickly grasping the cost breakdown and the significant difference in retail prices between the two scenarios. When this spread widens, it serves as a key indicator of refining profitability, yet it directly burdens the end consumer with higher pump prices.