
2012 Volume Issue 4
March 1, 2012
For a downloadable version, click the following:
March 1, 2012, WHY IS THE FEDERAL RESERVE SYSTEM (FED) SO PROFITABLE?
WHY IS THE FEDERAL RESERVE SYSTEM (FED) SO PROFITABLE?
…and the Consideration of Some of the Resulting Implications (Part One)
This is the first in a short series of articles on this website focusing on the profitability of the Federal Reserve System (FED) and a variety of questions and implications flowing from such profitable operations.
The Federal Reserve System (FED) has nearly always been highly profitable both in an absolute and relative sense. This article will examine why it is so. In the last few years those profits have risen significantly upward despite the fact that the FED was supposedly buying the 'junk', called toxic assets, in order to bail out a variety of financial institutions here and abroad. Given the high rates of compensation with which the executives of these bailed out institutions were rewarded, they should have known better and not been so naÏve or so greedy as to chase risk in order to seek higher yields.
Remember TARP, the QEs 1-3, Maiden Lanes 1-3, etc., etc. The remaining articles in this series will be posted in the very near future. Keep tuned in!!
Tracing the Fed's profits and putting their size into perspective
What happens to those profits? The FED uses some of its profits to match the capital paid in required of member institutions resulting in a doubling of the size of total capital which is analogous to owner's equity for private sector 'for-profit' firms. The Capital Paid in is the total cost of stock the members acquire. Remember that the stock of the FED does not trade in the financial markets. The member institutions of the Federal Reserve System receive a 6% dividend on their Capital Paid in.
After meeting all such requirements, the balance of the FED's profits are transferred to the U.S. Treasury and are included under corporate profits taxes in the social accounts such as the National Income and Product Accounts (NIPA).
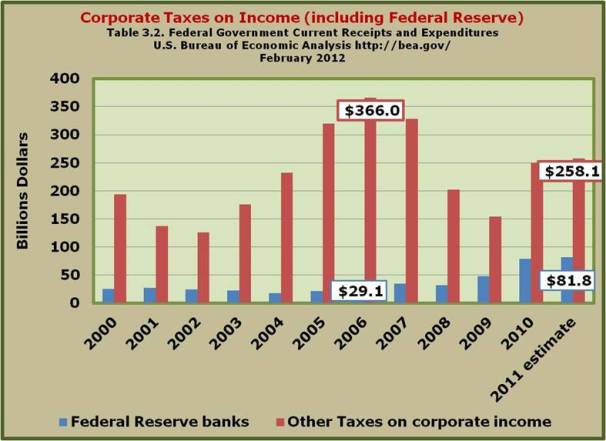
This transfer of the remaining profits to the U.S. Treasury is really a subsidy to the Treasury and in effect a hidden tax on the financial institutions that are members of the Federal Reserve System. As we have seen in other articles on this website, if not taxed directly as in the case of the Personal Income Tax, the final burden of all taxes is born by households who ultimately bear the burden of all taxes whether directly or indirectly from the forward and backward shifting of taxes no matter where the initial incidence falls.
TAX PROPOSALS HERE, TAX PROPOSALS THERE, TAX PROPOSAL EVERYWHERE…BUT HOW DO WE ANALYZE THEM?
November 8, 2011
www.econnewsletter.com/nov082011.html
One of the best minds of this past century in the area of public finance, the now deceased Richard A. Musgrave, a former professor of mine many years ago, would lament in his lectures and in his text book, The Theory of Public Finance (1959), that no matter what the law says, who actually is the ultimate bearer of all or part of the profits tax, can differ dramatically from one case to another. After going through a kind of verbal games theory of analysis, he concluded that one guess is probably as good as another and perhaps the assumption as to who on average bears the corporate profits tax would be one-third of the final burden resting on the buyers (higher prices), one-third on the equity capitalists (stockholders in the form of lower dividends), and one third on the other productive resources such as labor (reduced wages/compensation). Imagine that, labor ultimately bearing one-third of a corporate profits tax on the firm employing labor.
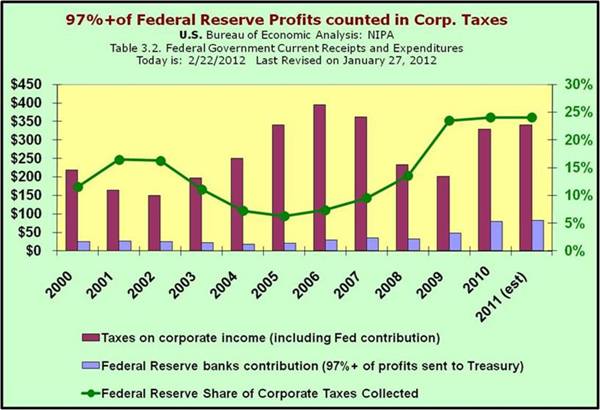
The following chart shows the relative importance of this disposition of the FED's remaining profits transferred to the Treasury.
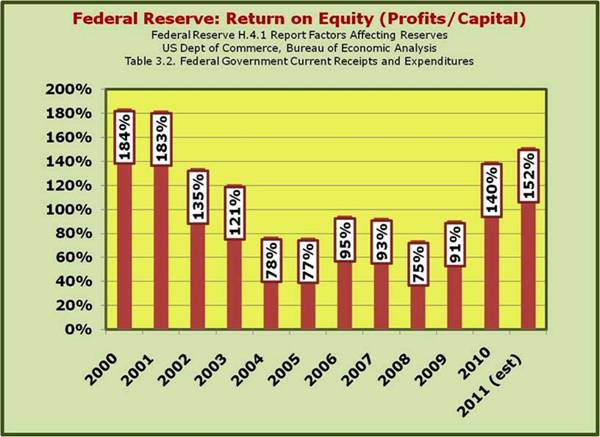
The FED is indeed [historically] the most profitable firm in the nation as measured by its rate of return on equity (ROE) as the following chart shows. Not even ExxonMobil with its cartelistic market power and a typical ROE in excess of 30% can come close to matching the profitability of the FED.

LARGE PROFITS BECOME EVEN LARGER
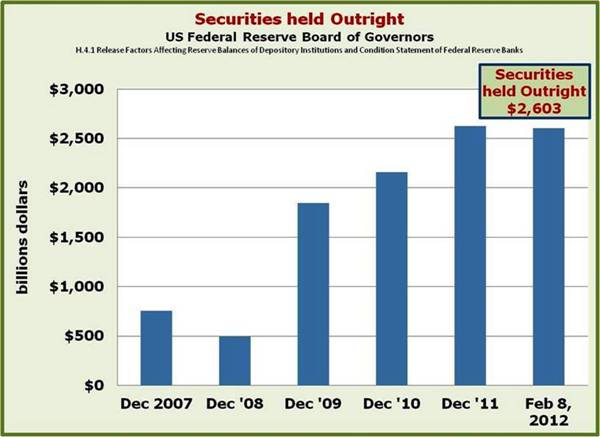
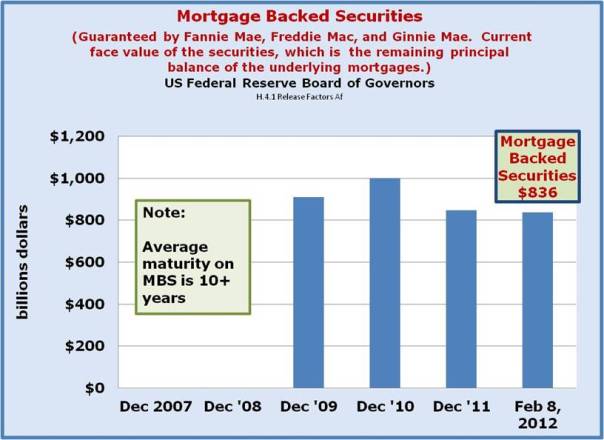
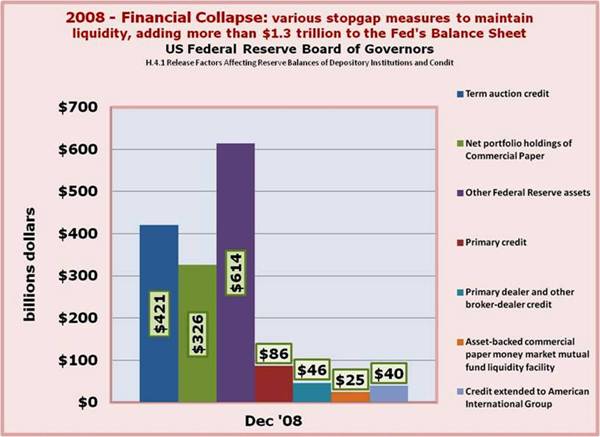
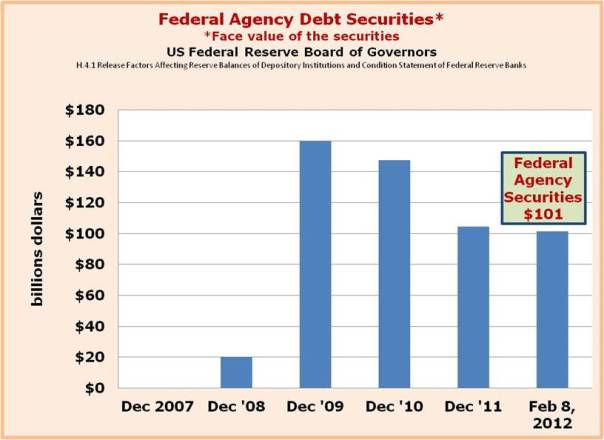
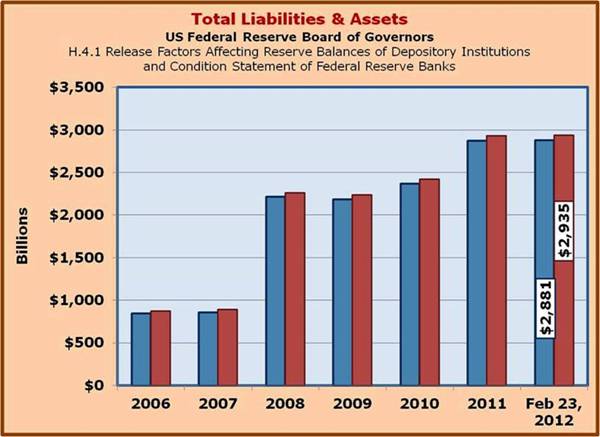
In response to the Financial Fiasco of 2008,the FED loaded up with such things as CDOs (consolidated debt obligations) including MBSs (mortgage backed securities). To help you see this transformation, you will find below several comparisons of the FED before the crisis of 2008 and since it intervened in the financial markets. This transformation could have been seen step by step by watching the weekly releases of the by the FED such as the H.4.1.
As the FED acquires assets, it has an expansive effect of the monetary base which in turn increases the capacity of the financial system to create more money and credit if the credit creating institutions in the system find it profitable to do so.
Most of such changes in the monetary base are found under the term 'Reserve Bank Credit' in the H 4 1 releases and includes:
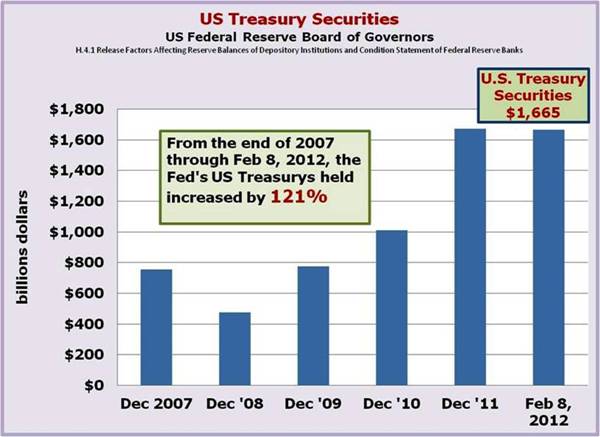
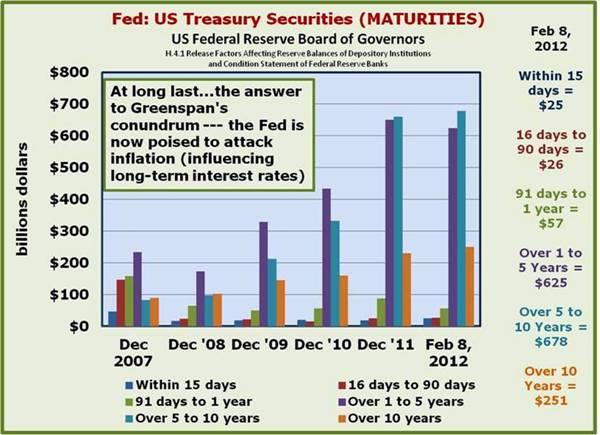
- Securities held outright (U.S. Treasury securities, Federal agency debt securities, and Mortgage-backed securities)
- Repos (or Repurchase Agreements)
- Loans (Primary, Secondary, Seasonal, Credit extended to AIG, Term Asset-backed Loan Facility (TALF)
- Portfolio Holdings of Maiden Lane(s) 1-3, etc.

Having graphically viewed this transformation of the FED's portfolio and related activities, let's first see why the FED was profitable before its intervention of 2008, and since then as well due to the extensive intervention in the financial markets by the FED. We will use the jargon of financial theory and analysis to achieve this. Later issues in this series will focus on related issues.
FINANCIAL THEORY AND ANALYSIS
The reader is encouraged to re-read other relevant issues of this newsletter on this or its archival websites, especially those listed at the end of this article.
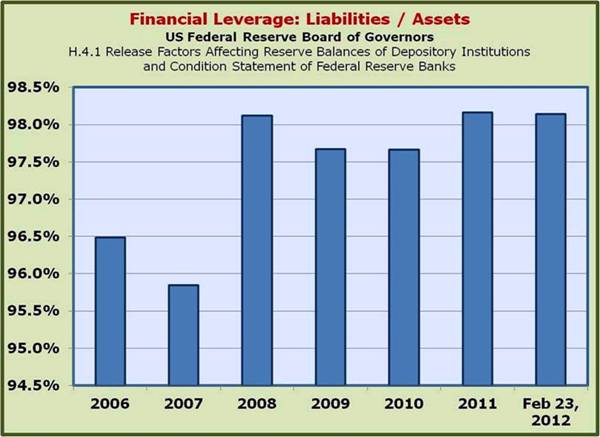
Operating and financial leverage
Operating leverage is defined as the ratio of profits to assets. That ratio is referred to as Return on Assets or ROA.
The degree of operating leverage or ROA ranges over a wide spectrum for firms. While some financially successful firms may experience a relatively high 10% annual return on assets, others experience a ROA of less than 1%. There are many factors that determine the profitability of a firm and its ROA, but one extremely important factor is the degree of competition they face in the markets in which they operate, both product or goods and services markets and productive resource markets such as labor and financial markets.
As a general rule, the lower the degree of operating leverage a firm experiences, the higher the degree of financial or debt leverage it will employ. The reason for this is that the two degrees of leverage, operating and financial, determine the firm's Return on Equity or ROE (the rate of return to the stockholders on their equity investment in the firm) for any given level of profits.
In much of manufacturing, successful firms will experience a much higher degree of operating leverage or ROA such as 6% or 8% than in much of the financial services industry, especially in the depository institution portion of the financial services industry, where a ROA is often less than 1%. If no debt (liabilities) were employed, in other words, zero financial or debt leverage were used, the Return of Equity (ROE) would be the same as the Return on Assets (ROA).
To earn reasonable rates of return to equity investors, a firm with a low degree of operating leverage (low ROA or low ratio of profits to assets) would have to employ a high degree of financial leverage (high ratio if liabilities to assets). Sure enough, depository financial institutions who create most of the money and a significant amount 0f the credit in our financial system, are considered successful if their return of assets is 1%. This would be dismal for a manufacturing firm which employs a much lower degree of financial leverage. But the typical depository financial institution uses a very high degree of debt or financial leverage often 90% or more (i.e. liabilities equal 90% or more of assets which means that owners equity is often less than 10% of assets).
Of course with such a thin buffer against bankruptcy, WELL MANAGED AND PRUDENT DEPOSITORIES SUCH AS COMMERCIAL BANKS CANNOT AND SHOULD NOT BEAR MUCH RISK! The ongoing financial crisis laid bare the ineptness, of highly compensated executive management of these institutions that the FED decided it had to 'bail them out.' In our example, a ROA of 1% could be leveraged up to a ROE of 12.5% if a very high degree of financial leverage were employed. In the example just given, liabilities being 92% of assets (owners' equity is only 8% of assets), a relatively low ROA or operating leverage of 1% results in a reasonable ROE even if profits are only 1% of assets. BUT THE DEPOSITORY MUST FORGO ANY SERIOUS AMOUNT OF RISK BEARING AND NOT CHASE YIELDS, OR EXECUTIVE MANAGEMENT IS FLIRTING WITH BANKRUPTCY!
The FED has a much higher [rate of] operating leverage for a depository financial institution. Granted it is not a typical depository. The typical well run depository financial institution has a return on assets or ROA (measure of operating leverage) of around 1%. In order to earn a reasonable return on owners' equity or ROE, depositories such as commercial banks employ a relatively high degree of financial (or debt) leverage (as explained immediately above).. This means that liabilities (for the most part) are typically about 90-92% of assets, with owners' equity being about 8-10% of assets.
Remember the balance sheet identity that the sum of assets must equal the sum of liabilities plus owners' equity.
A = L + OE
With financial leverage reflected in liabilities at 90% of assets, AN ROA OF 1% is leveraged by a multiple of 10 and yields a 10% ROE.
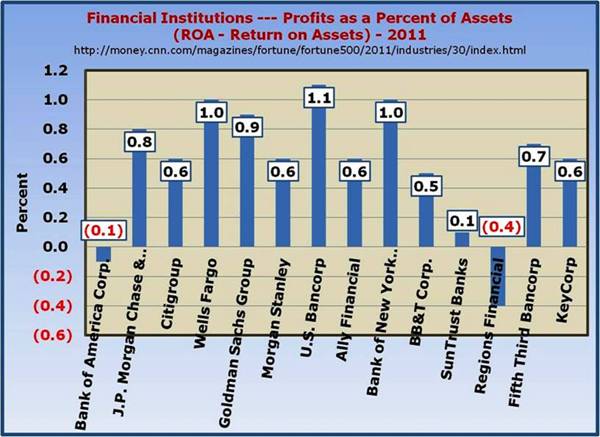
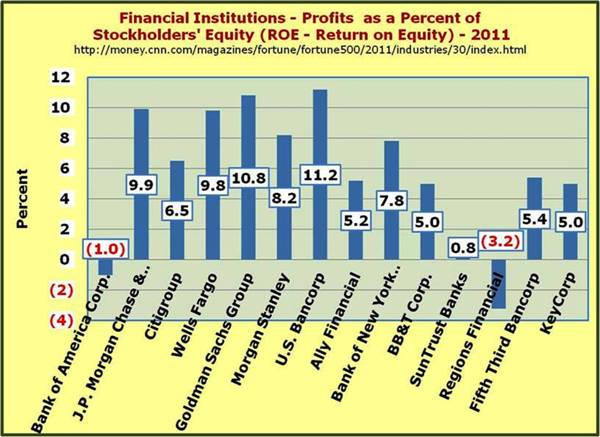
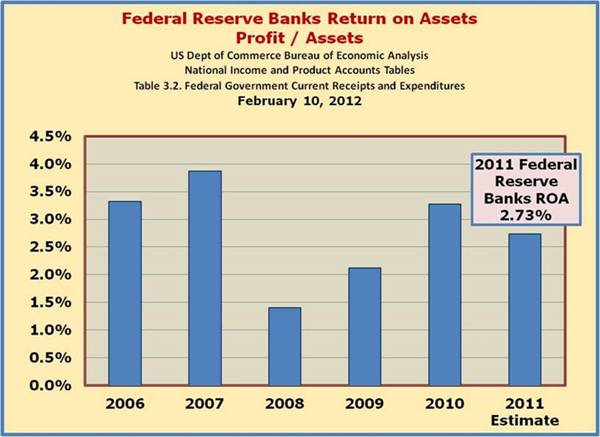
As the chart above shows, the FED experiences a much higher ROA than do private sector depositories, such as commercial banks. In 2006, a pre-crisis year through the just ended 2011, the FED's ROA ranged from about 1.5% to nearly 3.5% as compared to a typically successful commercial bank's 1% ROA. The FED employs a much greater degree of financial leverage as well. Its ratio of profits to total capital (the equivalent of owners' equity for a 'for-profit' private sector firm) ranged from around 100% to 150% over the same time period. See charts on pages 7 (ROE) and 11 (ROA).
How has the FED been able to achieve such a high ROA? Using the language of financial theory, it has a very low weighted average cost of capital or WACC. It pays virtually nothing on many components of its capital. Until very recently, reserve deposits of member institutions were paid zero interest on them. That was recently changed but still is now at only a fraction of 1%. In past years a number of services were provided free or at very low cost to the member institutions by the FED. But gradually in the Post WWII period, those services became costlier to the member institutions.
Another very large source of debt capital is the issuance of Federal Reserve Notes. This of course comprises nearly all of the legally circulating paper money of our system. The Notes are a non-redeemable, non-interest bearing liability of the FED, giving this component of its capital a zero cost. Some of the liabilities such as U.S. Treasury Deposits earn a more market like rate but are a relatively small portion of its liabilities.
A peek at the FED as the federal fiscal...
www.federalreserve.gov/publications
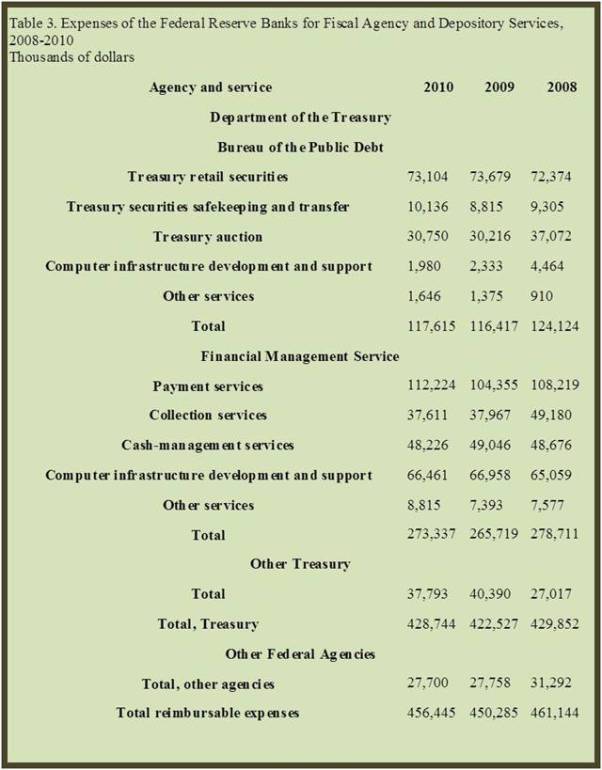
For a more in-depth look at the FED's role as fiscal agent…
The Federal Reserve Banks as Fiscal Agents and Depositories of the United States
www.federalreserve.gov/pubs/bulletin
Finally, the 'Capital Paid In' receives a dividend of 6%. This results in a very low WACC. This means that the margin between the earning assets of the FED and the cost of capital on the liabilities and capital that finance the assets is very large compared to private sector firms' margin that have a relatively higher weighted average cost of capital or WACC.
These are much larger leverage factors the FED experiences compared to commercial banks, for example, and as result the FED earns much higher return on equity or ROE than do private sector 'For-Profit' firms.
Some further articles to read related to the Fed
IS THE FED TIGHTENING THE SCREWS ON BANK LENDING?
…risk based capital ratios reconsidered
CAPITAL RATIOS, OPERATING AND FINANCIAL LEVERAGE
July 16, 2011
www.econnewsletter.com/jul162011.html
WHAT PRICE BAILOUTS? WHAT PRICE THE ELIMINATION OF THE GLASS-STEAGALL RESTRAINTS AND THE continuance of the 'TOO BIG TO FAIL DOCTRINE'?
September 30, 2011
www.econnewsletter.com/sep302011.html
WHAT IS LEFT FOR THE FEDERAL RESERVE POLICY MAKERS (FED) TO DO?
Could a QE 3 be meaningful?
August 8, 2011
www.econnewsletter.com/aug082011.html
Why are interest rates so low?
January 12, 2012
www.econnewsletter.com/jan122012.html
(The Financial Fiasco of Two-Thousand Eight (FFTTE))
January 2, 2009
www.econnewsletter.com/jan022009.html
THE FEDERAL RESERVE SYSTEM
December 31, 2003
www.econnewsletter.com/dec312003.html
...there are many more on the FED as well
www.econnewsletter.com/home.html
End of Part I of this series
