2013 Volume Issue 1
February 12, 2013
For a downloadable version, click the following:
…a bit more compressed version of the PDF
Separating the Light from the Heat: an analysis of the income distribution and the endless clamor for its redistribution; the whys, wherefores, and implications
This newsletter will examine the various aspects of the ongoing clamor for income redistribution. It will focus of the application of the theoretical economic welfare conditions as a guide to the analysis. Some inequalities in the income distribution are necessary to assure a resource allocation that reduces the burden of scarcity and is consistent with justice. The distinction between the short run and the long run of the necessary inequality in the income distribution to achieve justice and reduce the burden of scarcity is considered. The causes of inequality in the income distribution are thoroughly examined as is the distinction between inequality and inequity in that distribution. Some data on the actual income distribution is appended at the end of this newsletter. Fasten your seat belts and away we go.
THE CONCEPTUAL FOUNDATION FOR THE ANALYSIS OF THE INCOME DISTRIBUTION
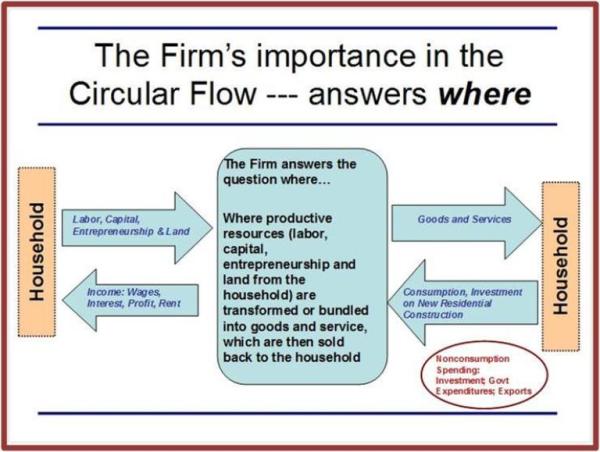
Just below is a circular flow of economic activity. While this article will focus primarily on the lower or the bottom half of the circular flow, a brief examination of the entire economic system and their interrelationships will prove helpful. The lower half shows the role of households as the suppliers of productive resources to firms that are the demanders of those productive resources and the places where the transformation process of production occurs.
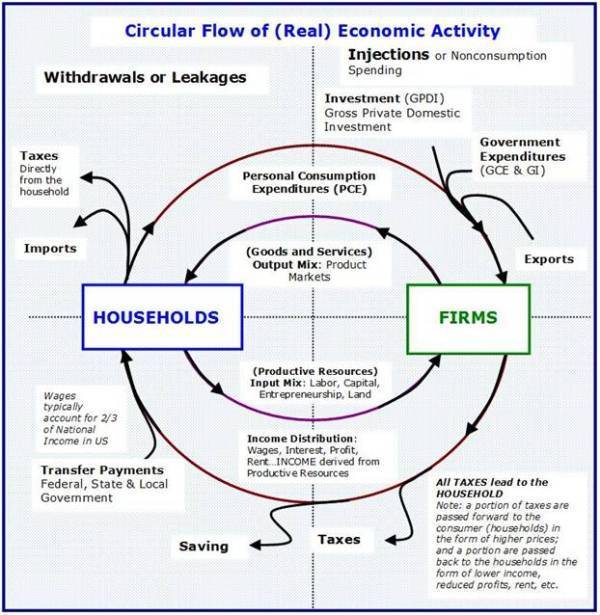
The traditional classification of productive resources consists of labor, capital, entrepreneurship, and land. The productive resources are transformed into useful goods and services in a process called production.
Shifting briefly to the top or upper half of the circular flow of economic activity, the goods and services so produced satisfy the personal consumption needs of the households (Personal Consumption Expenditures or PCE), the investment demand for capital goods by domestic firms to replace their stock of capital goods as it wears out or becomes obsolete and to expand that stock (Gross Private Domestic Investment or GPDI), collective consumption and investment as determined by governments (Government Consumption Expenditures and Gross Investment or GCE&GI), and the demand by the rest of the world for our domestically produced goods and services as expressed in the term exports.
It should be noted that the domestically produced goods and services are supplemented by the importation of foreign produced goods and services which are called Imports. In the official measures of economic activity just described, imports of goods and services are netted out form the exports of goods and services and the net amount is termed Net Exports of Goods and Services or NEGS.
The term, Aggregate Demand for our goods and services, is the sum of the four, PCE plus GPDI, plus GCE&GI, plus NEGS.
Economic activity is measured four times a year. After measuring this quarterly data, the Bureau of Economic Analysis of the United States Department of Commerce publishes it online and in its monthly publication, the Survey of Current Business.
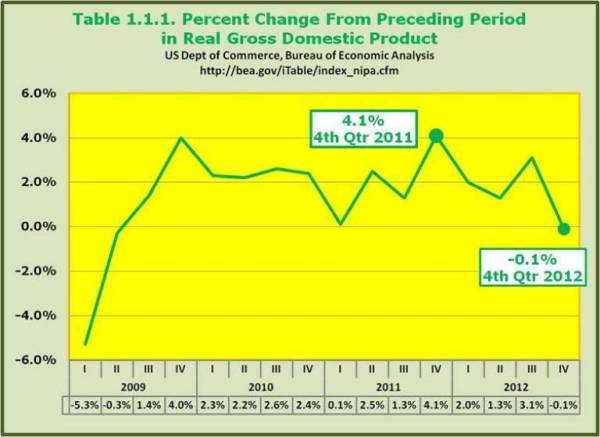
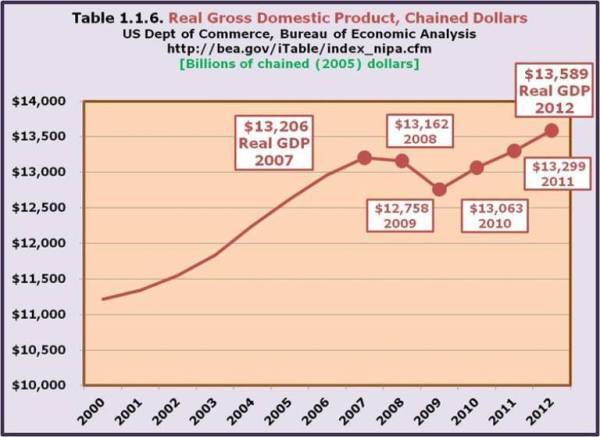
US Department of Commerce, Bureau of Economic Analysis
The markets for goods and services or the product markets can be seen in the upper half of the circular flow of economic activity. Note that in these markets, the Household Sector is one of the four demanders of this production (Personal Consumption Expenditures). The firms are the suppliers to these product markets to satisfy the needs of households as well as to the other three components of Aggregate Demand.
The lower half of the circular flow of economic activity centers on the markets for productive resources: labor, capital, entrepreneurship, and land. In a pure free market capitalistic system, all productive resources are supplied by the households. The firms are now the demanders for these productive resources and the households are the suppliers.
Take note of the reversal of roles of households and firms in the product markets as contrasted with the markets for productive resources.
Households are suppliers in the markets for productive resources while they are demanders in the product markets for goods and services. Firms are the demanders in the productive resource markets and suppliers in the product markets for goods and services.
This is important to understand since much of the inequality and inequity in the income distribution is due to control of supply and price, i.e., the exercise of market or monopoly power. This point will be much more deeply examined later on in this article.
SOME CONCEPTUAL AMBIGUITIES AND CLARIFICATIONS
The term income, unqualified by such terms as personal or disposable, has a very specific meaning. Income is the reward to a productive resource such as labor or capital, for the current offering of a productive resource to a firm in the transformation process of production.
As we shall later discuss, a receipt in cash or in-kind not so earned, is a transfer payment and not income in its pure and unqualified sense. The only qualifying word that does not violate the definition of income is the word national as in National Income. This is simply the aggregation of individual households’ income during a given period. Also, most of the sale prices of assets by households are not income but simply the liquefying of one’s wealth. An exception to this would be the profit made on such a sale if it resulted from the current efforts of a household’s productive resources.
Income is a flow and must be distinguished from wealth which is a stock.
The two are related but different conceptually. Confusion reigns as a result. Does rich mean earning a relatively large income or does it mean having a large net worth? The saving of part of one’s income by deferring consumption can add to one’s wealth. As a person accumulates assets and becomes wealthier in this sense, it will add to a person’s ability to supply capital to the production process, directly or indirectly. These investments in capital will increase a person’s income. In this manner, wealth is a stock that is related to income which is a flow. It is very possible to have a large income but have very little wealth at the same time. An example of this would be a celebrity afflicted with a condition called ‘Big Spender’.
From Bank To Broke: 20 Celebs Who TANKED Their Fortunes
In analyzing the income of the productive resource, labor, the concept of human capital becomes critical to understand. Much of the increased productivity of labor is due to workers investing in themselves. Formal education, especially in areas such as science, resulting in degrees and being licensed in engineering or medicine as well as in other business areas such as accounting, finance, and economics, are becoming increasingly necessary to assure a worker of a reasonably high income. That portion of a worker’s reward for participating in the production process is considered part of Compensation to Employees and not as the reward for supplying capital to the firm.
Training and participation in conferences and other such venues are also helpful in labor’s embodiment of human capital. It requires the discipline of deferring immediate gratification from leisure or consumption to enable such an embodiment of human capital in the worker. But this investment is not shown as part of Gross Private Domestic Investment. It does not appear in the household investment portion of GPDI. It is typically shown as personal consumption if paid for by the worker, written off as an expense if provided by business or if financed by government, it is buried in Government Consumption Expenditures and Gross Investment.
If it were treated as part of GPDI, some of the compensation to labor would really be the reward to the productive resource’s debt or equity capital invested in that person and be in the form of interest or profits. One should be aware of this treatment by the BEA in the National Income and Product Accounts (NIPA), especially in the area of government policies impacting the income distribution.
POPULARITY OF FREE MARKET CAPITALISM AND THEORETICAL WELFARE ECONOMICS
Capitalism After the Crisis
Luigi Zingales
FROM ISSUE NUMBER 1 National Affairs ~ FALL 2009
www.nationalaffairs.com/doclib/20091229_Zingales_Fall09.pdf
When business and government are bedfellows
Economist – August 23, 2012
Conversation with Luigi Zingales
www.economist.com/blogs/prospero/2012/08/quick-study-luigi-zingales-crony-capitalism
As we have pointed out in earlier newsletters, most of the polls over time reveal that the majority of Americans favor free market capitalism as long as it is not dominated by Big Business; translated into more theoretical terms, as long as the system is competitive. What are the goodies resulting from COMPETITIVE free market capitalism?
The limiting case or end game of a free market capitalistic system is one in which all markets are perfectly competitive and in long term equilibrium. This means that no firm or productive resource in either the product markets for goods and services nor the productive resource markets for labor, capital, entrepreneurship, and land, possess market or monopoly (nor monopsony) power. Demanders and suppliers in all markets are pure price takers and not price makers, as the expression goes.
In this limiting case, only approached in a few markets, the microeconomic and macroeconomic welfare conditions would exist. On a microeconomic level they are the conditions of efficiency and equity. On a macroeconomic level, they are high employment and a reasonable degree of price level stability. Before we examine each of these conditions, it is necessary to point out that the extreme of limiting cases of monopoly and monopsony, are also never completely achieved in reality.
What is essential to see is that the two limiting cases of the complete absence of competitive and the perfect presence of competition are but the two ends of the spectrum of market structures or degrees of competition. Think of a semi circle of 180 degrees. At the left end is the condition of pure or complete monopoly and monopsony in all markets. There is only one seller and one buyer in each market and there are no substitutes available to either buyer or seller.
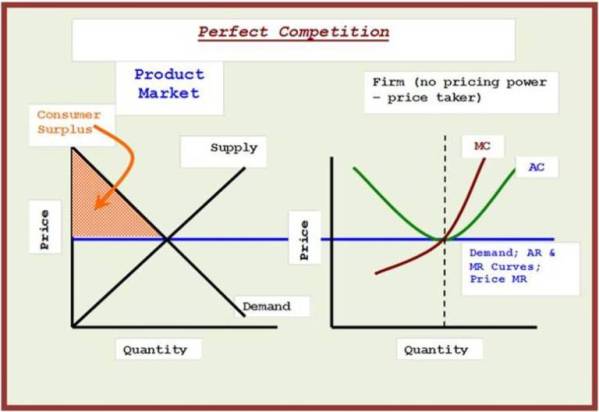
At the other end of the spectrum, all markets are perfectly competitive and in long term equilibrium. There are numerous buyers and sellers in all markets so that no buyer or seller has any price power whatsoever; transactions occur at the equilibrium price level in each and every market. There is zero quantity supplied to demanders at a lower price than that in the market. A zero quantity demanded faces suppliers at prices above that in the equilibrium price in each market. Graphically, the supply and demand curves facing each entity, be it a firm or a household, is a horizontal line at the level of the markets’ long term equilibrium prices.
These are the ‘signature’ conditions in perfectly competitive markets, as the current popular expression goes. As the degree of competition decreases in a market, that market moves away from the micro and macro welfare conditions of equity, efficiency, high employment, and each market’s contribution to a reasonable degree of price level stability.
But as the degree of competition increases in markets, they move increasingly towards the achievement of the theoretical economic welfare conditions just mentioned. In effect, the demand curves facing the suppliers begin to rotate toward the horizontal increasing the price elasticity of demand at each price and making price increases less and less revenue enhancing.
Many light weight critics, often ideologically driven, argue that since the extreme conditions do not exist in reality, the theoretical economic welfare conditions have no relevance.
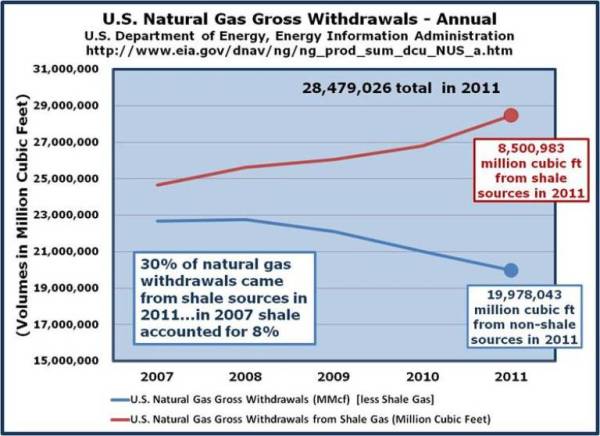
Nonsense! Just look at the market for natural gas and how its price fell, and now it appears that downward price pressures will soon be increasing for crude oil as fracking technology increasingly enters the picture. It has increased the competition greatly and the more traditional firms have no choice but to lower prices and compete. The opposite picture occurred when the U.S. segment of the oil industry was re-cartelized over the approximately ten year period of 1993-2003. The price of crude oil and its downstream derivatives rose to record highs and stayed there due to decease in competition as 15 oil firms consolidated into 5 including the merger of Exxon and Mobil.
Tight oil and gas along with shale oil and gas are terms used to distinguish oil and gas extraction from shale using horizontal drilling and fracking technique as contrasted with traditional vertical wells drilled into pool-like reservoirs.
www.shell.us/home/content/usa/aboutshell/shell_businesses/onshore/shale_tight/
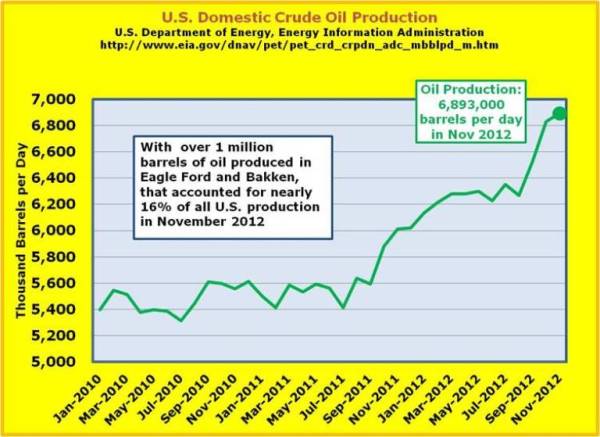
Examine the following data just published for production of crude oil with the aid of the ‘fracking’ technology.
Is Bakken set to rival Ghawar?
Fri Nov 9, 2012
By John Kemp
www.shell.us/home/content/usa/aboutshell/shell_businesses/onshore/shale_tight/
“But Bakken's exponential growth and enormous reserves put it on course to produce more than 1 million barrels per day by the middle of next year, which will earn it a place in the small pantheon of truly elite oil fields.”
http://www.bizjournals.com/sanantonio/news/2013/01/23/eagle-ford-oil-production-is-up-70.html
Oil production in the Eagle Ford Shale topped 358,826 barrels per day during the month of November, according to the Texas Railroad Commission.
www.rrc.state.tx.us/eagleford/index.php
338,911 barrels per day (average…January – November 2012)
www.dmr.nd.gov/oilgas/directorscut/directorscut-2013-01-11.pdf
Nov 2012 Oil 21,992,345 barrels = 733,078 barrels/day
The combined crude oil fracking output from Bakken (North Dakota/Montana) and Eagle Ford (Texas) is well over 1 million barrels per day: Bakken was at around 100,000 barrels per day in 2008; Eagle Ford’s production is up from nearly zero (358 barrels per day) in 2008.
It appears to be a repeat of what happened to natural gas pricing when the Marcellus Shale field began to be exploited. Now it is the Bakken and Eagle Ford shale fields coming on with a vengeance with others just around the corner. Adam Smith’s Invisible Hand of Competition still works its magic in destroying the ability of firms possessing market or price power to exploit the ‘Body Politic’.
www.econnewsletter.com/apr262012
Adam Smith’s Invisible Hand
One of the most famous terms he coined by Adam Smith, was the “INVISIBLE HAND”. He was referring to vigorous competition in markets. He only used it a few times (once in Wealth of Nations) but it is central to his support of free market capitalism. In effect he was saying, do your damndest to maximize your self-interest, but if the Invisible Hand of vigorous competition is present in the market, your self-interest will also lead toward a maximization of the common good.
Of course, absent the Invisible Hand, all bets are off. In that case he explained that,
“People of the same trade seldom meet together, even for merriment and diversion, but the conversation ends in a conspiracy against the public, or in some contrivance to raise prices.”
As competition increases in markets and per capita production and real income rise toward their maximum, the theoretical economic welfare condition of efficiency is approached more closely.
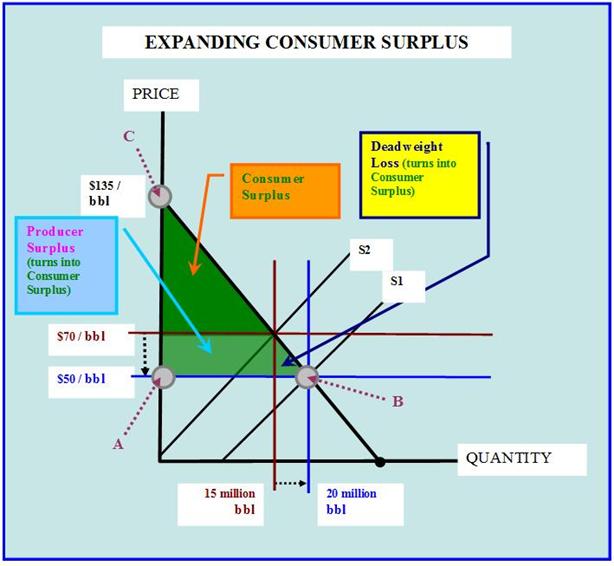
As the condition of equity is similarly approached, the reward or income to productive resources approaches their opportunity cost level and any surplus rewards (producer surplus or economic rent) is gradually eliminated and the price paid by buyers falls, increasing the consumer surplus towards its maximum.
Efficiency
Efficiency means that the per capita standard of living is at a maximum given the stock of resources, technology, etc. The consumer is able to purchase the greatest quantity of goods and services at the lowest possible price, thus maximizing their income. This can be viewed as the consumer’s income having the most ‘bang for the buck.
In the following instance, while the price is tangent to the average cost curve, it is still above the marginal cost. This indicates a violation of the efficiency principle.
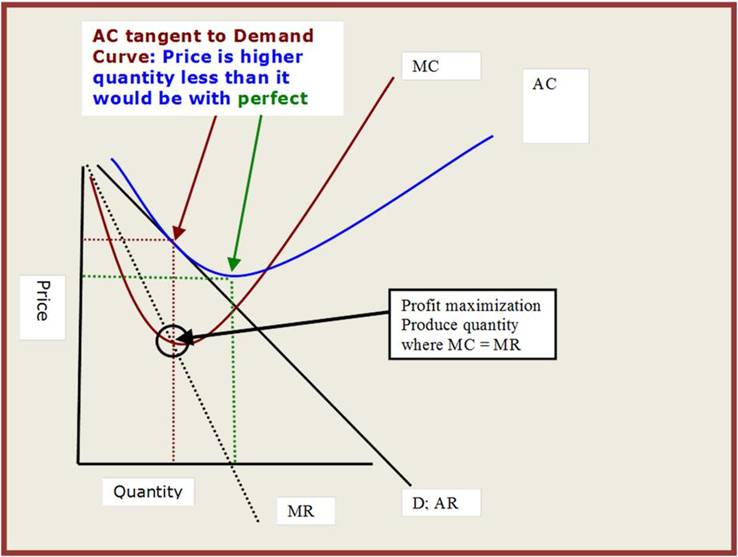
Theoretically, efficiency exists when for the typical firm in a perfectly competitive market, price equals its marginal [opportunity] cost and its average [opportunity] cost is at a minimum.
On a macroeconomic level, as competition increases the downward flexibility of prices increases and the twin biases toward recession and inflation are gradually reduced. Recall that decreasing competition makes prices more rigid downward introducing an increase in the bias of the macroeconomy toward recessions and unacceptably high rates of inflation.
Equity is not equality; separating the necessary and just inequality in the income distribution from excessive and unjust inequality in the income distribution…
Much of the recent electioneering was focused on changing the tax structure to redistribute income and reduce the inequality in the income distribution. Government expenditures have also been used in an attempt to achieve such a redistribution of income. ‘Obamacare’ is one such measure, as are Medicaid and Family Income Allowances. The basic question that is rarely probed deeply enough but will be the focus of the remainder of this article is this; when is the income distribution excessively unequal and unjust? Ah that is the question.
We have seen in earlier articles on this web site, that when competition is complete or ‘perfect’ and all markets are in long term equilibrium, the theoretical economic welfare condition of equity is achieved.
When markets are perfectly competitive and in long term equilibrium, the efforts of productive resources and firms to maximize their self interest or pursue s surplus rewards beyond their opportunity cost level of rewards, the result will, nonetheless, be equitable and consistent with the concept of commutative justice. Each and every productive resource whether labor, capital, entrepreneurship, or land, earned their opportunity cost level of reward, no more and no less. The buyers in markets paid the lowest price possible consistent with the condition that all productive resources receive their opportunity cost for participating in the transformation process of production.
- ECONOMIC RENT
- “According to Robert Tollison (1982), economic rents are "excess returns" above "normal levels" that take place in competitive markets. More specifically, it is "a return in excess of the resource owner's opportunity cost".”
- In such an idealistic world, equity would be achieved. Remember that every human being is a consumer whether or not they are also a productive resource. The achievement of the economic condition of equity also means that the consumer surplus is maximized. A portion of that consumer surplus is received by every consumer and the set of all consumers is much larger than the set of al productive resources. This assures less inequality in the income distribution that if the consumer surplus was expropriated by the smaller population set of productive resources through their use of monopoly or market power such as business cartels, labor unions, and political favors as encompassed in the term, Rent Seekers, including the excessive use of licensing and excessive durations of patents and copyrights.
http://en.wikipedia.org/wiki/Economic_rent
- Rent-seeking
- “The phenomenon of rent-seeking in connection with monopolies was first formally identified in 1967 by Gordon Tullock. The expression rent-seeking was coined in 1974 by Anne Krueger. The word "rent" does not refer here to payment on a lease but stems instead from Adam Smith's division of incomes into profit, wage, and rent. Rent-seeking behavior is distinguished in theory from profit-seeking behavior, in which entities seek to extract value by engaging in mutually beneficial transactions.”
http://en.wikipedia.org/wiki/Rent-seeking
As the Invisible Hand of Competition works its wonder and the competitive markets move toward long term equilibrium, economic rent (producer surplus) is reduced and the consumer surplus, including the recapture of some of the dead weight loss, moves toward its maximum.
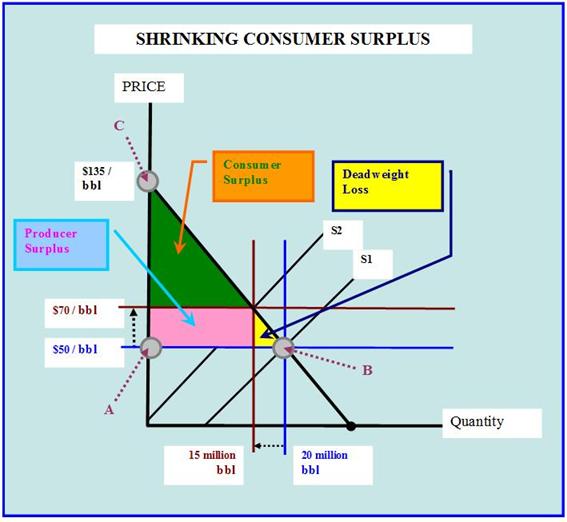
Absent significant competition, productive resources either directly in the productive resource markets such as for labor and capital, or indirectly through the market power of the firms that employ the productive resources, expropriate some if not most of the consumer surplus and convert it to producer surplus (economic rent) minus a dead weight loss. This is the source of most of an excessively unequal income distribution. Though possessing and exercising such market (also called monopoly or price power) the few gain at the cost of the many.
Not only does this result in an unjust and excessively unequal income distribution, but it also violates the economic welfare condition of equity as well as the other micro and macroeconomic welfare conditions. Specifically, it results in a lower per capita standard of living (violation of the condition of efficiency) but also by introducing downward price rigidity in markets, employment falls short of the high employment levels achieved by competitive markets and it introduces a bias towards an unacceptably high rate of inflation. Much of the intervention of government through fiscal and monetary policy is for the purpose of coping with the economic problems caused by lack of significant competition in the product and productive resource markets. Such interventions are at best a poor substitute for competition and absorb productive resources in the process of executing government economic policies thus increasing the burden of scarcity.
EXCESSIVE INCOME INEQUALITY IN THE SHORT TERM VERSUS THE LONG TERM
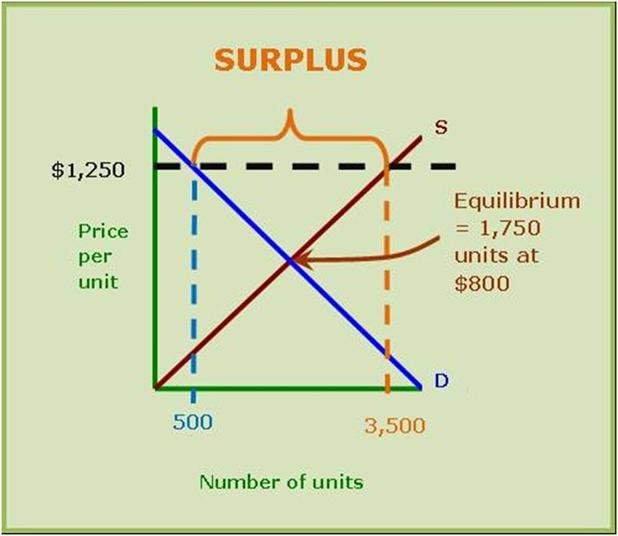
A market is the heat of a communications system. When at a given price the quantity supplied exceeds the quantity demanded, a surplus exists. In most cases, supply and demand are normal i.e., as the price decreases, the quantity supplied decreases and the quantity demanded increases. There have been a few notable exceptions to this such as when a backing bending supply curve exists over a relatively high price range, but in the large majority of cases, the surplus will put downward pressure on the market price and as quantity supplied decreases and quantity demanded increases, the surplus is gradually eliminated and the market equilibrium restored.
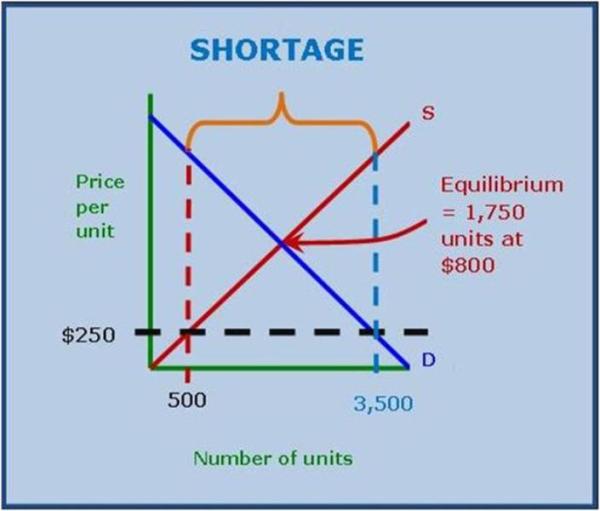
The reverse is true when the price is below its equilibrium level. In this case the quantity demanded exceeds the quantity supplied and a shortage exists. This puts upward pressure on the market price causing the quantity demanded to decrease and the quantity supplied to increase, gradually eliminating the shortage until the equilibrium price is reached and the market is cleared as quantity demanded becomes equal to quantity supplied.
Shortages indicate to rent-seekers (this term used in its broadest sense of productive resources seeking rewards above their opportunity costs) that if they can supply this market, more than normal or surplus rewards are available to the firm and its productive resources. Such excess rewards causes excessive inequality in the income distribution initially, but as the supply to the market increases, the price gradually moves downward towards its equilibrium level and the economic rent or producers surplus is gradually eliminated. The reverse is true if a surplus in the market occurs. In this case, a negative rent or a negative producer surplus exists and causes firms with their productive resources to exit this market and seek other markets where the rewards are sufficient or even greater that needed to employ the firm and its productive resources. Such a movement of productive resources and the firms employing them is necessary to assure efficiency in satisfying the demands of society. Temporary surplus rewards are the signaling device to cause the migration of productive resources toward their most valuable use.
This is why markets are a vital communications system in society’s efforts to cope with the ever present problem of scarcity. The movement of firms and its productive resources into and out of markets is not always instantly and perfectly achieved. Leon Walras wrote extensively on the various nuances of the role of the market in dispatching resources where they best serve society’s needs.
www.econlib.org/library/Enc/bios/Walras.html
“Before Walras, economists had made little attempt to show how a whole economy with many goods fits together and reaches an equilibrium. Walras’s goal was to do this. He did not succeed, but he took some major first steps.”
If the rent-seekers (again using this term in its broadest sense and not just in its sense of currying political favor) enter markets due to shortages, they are instruments of bringing about a resource reallocation that brings about a higher standard living to society, regardless of their motive. It increases competition and moves the market toward the economic welfare conditions described earlier in this article.
Changes in technology and the quantity and productivity of resources that lie behind supply; as well as changes in such things as buyers’ preferences laying behind changes in demand, causes the rise of possible surplus rewards in the short run. Such temporary surplus rewards to firms and productive resources are necessary for the economy to be efficient in meeting the needs of society as it strains to overcome scarcity.
When however, the surplus rewards or economic rent arises from the possession and exercise of market or price power due to a lack of competition or the spread of misinformation through advertising, society is harmed and the markets are kept from achieving the theoretical economic welfare conditions. Society is worse off even though the firms and its resources benefit from the exercise or monopoly or market power. This is the major cause of an excessive and unjust and inequitable income distribution and eventually raises the cry for income redistribution policies by government. This cause of excessive income inequality in the income distribution is also a result of the market imperfections, to be examined shortly. As firms and the productive resources they employ achieve market power, they prevent the markets from bringing about the theoretical economic welfare conditions.
The possession and exercise of market power results in an excessive inequality and inequity in the income distribution and also precludes the achievement of the other economic welfare conditions. Inefficiency occurs resulting in lower per capita standard of living, less that high employment, and unacceptably high inflation rates result from the exercise of market power due to a lack of significant competition. Such failures to achieve the economic welfare conditions are major reasons for government intervention, even though that intervention often fails to a great extent in bringing the economy closer to the achievement of the economic welfare conditions. Indeed, in more than a few cases, society is worse off than if the intervention had not occurred due to the need for productive resources to implement such economic policies of government.
The re-cartelization of the U.S. segment of the crude oil industry and the ill-advised environmental policies of effectively mandating (subsidizing) dent corn production for expanding ethanol production are but two such examples.
www.econnewsletter.com/mar272012
1990s MERGER MANIA higher prices today
Some of the arguments for consolidation included the desire to increase efficiencies and provide petroleum products at lower cost to the consumer...sure thing
- 1997 Ashland Oil combines most assets with Marathon Oil
- 1998 British Petroleum (BP) acquires Amoco
- 1998 Pennzoil merges with Quaker State Oil
- 1999 Exxon and Mobil join to form Exxon Mobil
- 2000 British Petroleum (BP) acquires ARCO (Atlantic Richfield)
- 2001 Chevron acquires Texaco to form Chevron Texaco
- 2002 Conoco merges with Phillips
- 2002 Royal Dutch Shell acquires Pennzoil-Quaker State
http://online.wsj.com/article/SB10001424127887323701904578276510884365252.html
“The agency said it intended to require U.S. refiners and fuel importers to use a total of 16.55 billion gallons of renewable fuel during 2013, compared with 15.2 billion gallons last year.”
As George Stigler (regulatory capture) argued, the agencies mandated to carry out the intervention are often ‘captured’ by those whose behavior they are supposed to change in order to bring our economy closer to the achieve of the economic welfare conditions. There are more than enough laws always legislated. The problem is that they are ineffectively enforced or the laws themselves are often poorly designed and preclude movement to the achievement of economic welfare. Political goals are often not coincident with the goals of achieving the theoretical economic welfare conditions. Ignorance in respect to the nature of these economic welfare goals abounds, especially when it comes to the income distribution and policies to redistribution income.
IMPERFECTIONS IN THE ECONOMIC SYSTEM OF FREE MARKET CAPITALISM
We have been stressing the damage done to economic welfare by firms and productive resources possessing and exercising price power (monopoly, monopsony, market and various other terms used to describe the ability of the few to exploit the system and give excessive and unjust rewards to those wielding the power in the markets). The system of free market capitalism or free enterprise, as it is often called, has it imperfections. We will briefly examine some of them since they are often the cause of legislation and government intervention seeking to correct either the imperfections or their results. Some of these imperfection that preclude the achievement of some if not all of the theoretical economic welfare conditions are natural monopolies, natural oligopolies, inability to exclude non-payers from the benefits of goods and services in such markets (called by some as non-rival in consumption), and external costs and benefits. Some of these imperfections were covered extensively in earlier newsletters on this website or in other articles on other websites and publications. We will focus on the first three just mentioned.
A combination of technological necessities in production and the size of the market lead to conditions where only one firm or only a few firms are needed to produce the goods and services without running into the problems resulting in diminishing returns in the short run and diseconomies of scale in the long run.
In the case of a natural oligopoly such as the light vehicle or crude oil markets, undue concentration not needed to keep costs low is to be constrained by the enforcement of anti-trust laws. Failures of varying degrees of intervention are just as common as successes from such intervention. Good legislative intentions do not assure appropriate legislation and effective enforcement of well designed laws.
Another market failure occurs when a market is not able to exclude non-payers. The good or service in question is said to be non-rival in consumption. So called free riders can enjoy the benefits without having to reveal preferences and pay. Pubic fireworks displays and flood control are examples of such a good or service.
As mentioned above, the presence of external costs and benefits prevent the goals of economic welfare from being achieved and the argument is used for government intervention into the way in which electric power is produced and in the government expenditures on education.
Government intervention to purportedly move the economy closer to the economic welfare goals and in a broader context, social justice can result in some of the inequality in the income distribution. Unfortunately, some of these interventions are the cause of inequalities in the income distribution as in the case of government employees including public education.
Ideological biases, broad and sweeping generalizations, and hugging and puffing are no substitutes for economic analysis in government policy making and its enforcement. The growing problems in areas such as the European Union point this out vividly.
- Income Distribution
- Measuring disparity
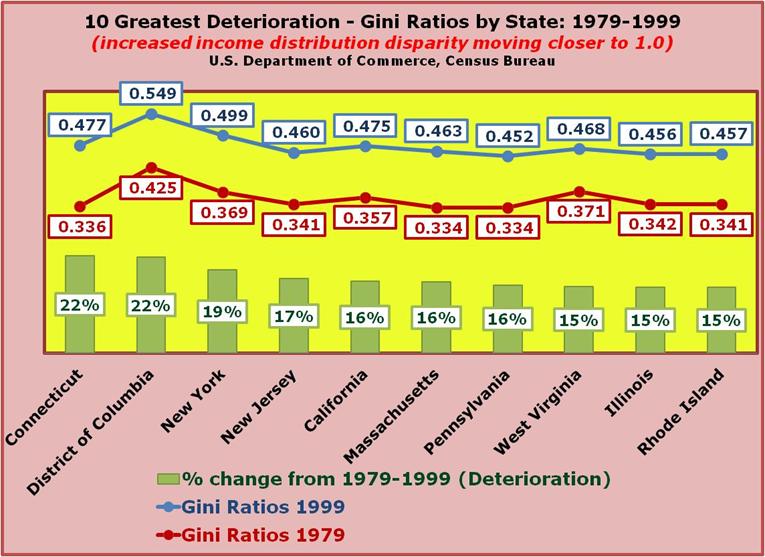
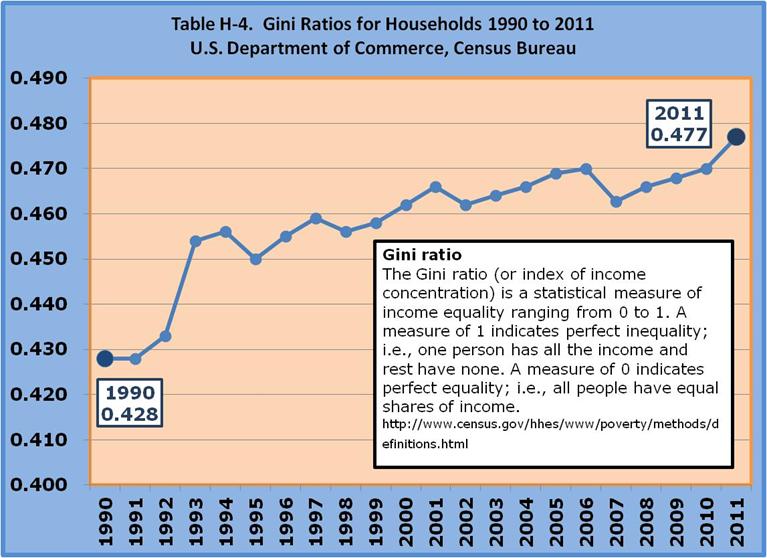
- Gini ratio
- The Gini ratio (or index of income concentration) is a statistical measure of income equality ranging from 0 to 1. A measure of 1 indicates perfect inequality; i.e., one person has all the income and rest have none. A measure of 0 indicates perfect equality; i.e., all people have equal shares of income.
www.census.gov/hhes/www/poverty/methods/definitions.html
Again, keep in mind that in the following graph citing the change in income disparity (Gini Ratio/Coefficient), an increase – moving closer to one (0.0 – 1.0), reflects an increase or worsening of the income disparity or inequality. The graph shows the change from 1979 through 1999, measuring the top ten states in terms of worsening income inequality as measured by the Gini Ratio/Coefficient.