
2013 Volume Issue 8
May 20, 2013
For a downloadable version, click the following:
…a bit more compressed version of the PDF
Clawing back to 2007 Employment Levels: 18 million jobs by the end of 2017
In April 2013, we saw the best month Employment Report from the Department of Labor, Bureau of Labor Statistics in quite a while.
THE EMPLOYMENT SITUATION —APRIL 2013
http://www.bls.gov/news.release/archives/empsit_05032013.pdf
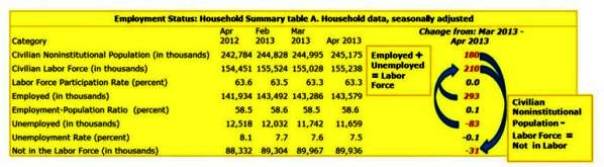
The Civilian Labor Force (Employed + Unemployed) expanded by 210,000, 30,000 more than the Civilian Noninstitutional Population grew (180,000 for the month).
Employed grew by 293,000 and unemployed fell by 83,000, while the 'not in the Labor Force' component also fell by 31,000; all very positive numbers for the month by any measure.
In a recent newsletter article we focused on the fallout from the various gaps: jobs; growth (GDP); and fiscal (widened deficits) www.econnewsletterapr092013.com/. In that article we identified a shortfall of 10.8 million jobs by applying a 66% Labor Force Participation Rate and 4.6% Unemployment Rate to the Current Population Statistics (Refer to Household Survey Household data Table A) based on 2007 annual rates as published by the U.S. Department of Labor's Bureau of Labor Statistics.
Working from the 10.8 million jobs number we noted the following:
In summary, we estimate that based on the 10.8 million jobs gap:
- There was a 'Compensation of Employees Gap' of $647,428,000,000 ($647 billion) in 2012 (based on an average compensation of $60,124 per employed (includes wages and fringe).
- Using the same logic, in developing the shortfall in the Compensation Gap, we arrive at a (nominal GDP) Growth Gap of $1,185,503,000,000 ($1.2 trillion) in 2012.
- On the Fiscal Revenue side, this translates into a 'Current Federal Receipts gap' of $516,726,000,000 ($516.7 billion) note: the deficit was about $1.2 trillion for calendar year 2012.
- On the Fiscal Expenditure side, there was around $200 billion of readily identifiable 'Income Security' items related to the job shortfall that would bring us back (categories include: Disability; Retirement; Welfare and social services; Unemployment; and Other) to pre-Recession.
On a further note, we failed to mention the impact of the change in Social Security Taxes, which went from the reduced rate of 4.2% (on the employee's side) back up to the standard 6.2% in January 2013. This tax increase should bring in an additional $125 billion in 2013.
Let's run through the effect of the added fiscal (federal budgetary) increases in revenue and reductions in expenditures (rough numbers). Starting with a $1 trillion federal deficit, it would be reduced by:
- $500 billion due to increased revenues in terms of 'Current Federal Receipts'
- $200 in reductions to 'Income Security' items related to the jobs gap (unemployment insurance, food stamps, disability claims, etc.)
- $125 billion increased revenue based on increasing employee's Social Security payroll tax from 4.2% to 6.2%.
This of course would bring the deficit down to a much more reasonable range ($150 to $250 billion).
Back to growing those jobs…
How do we know when we're on the right track?
WILL THE ECONOMIC ROAD TO RECOVERY FOR THE U.S. BE A ROUGH, ROCKY, AND UPHILL STRUGGLE?
2012 Volume Issue 7
March 15, 2012
www.econnewslettermar152012.com/
Is Full Employment No Longer A Realistic Goal for this Decade?
May 12, 2010
www.econnewslettermay122010.com/
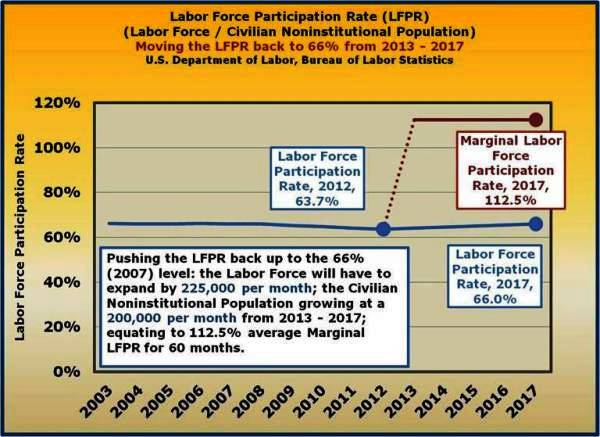
Yes, we've gone through this scenario on numerous occasions. In our current situation, the mechanics are quite simple: grow the jobs (Employment) by 10.8 million, plus make sure that additional growth in the Civilian Noninstitutional Population (those aged 16+ not in institutions, e.g., military, incarcerated, etc.) reflects the 66% Labor Force Participation Rate [Labor Force (those employed and those unemployed seeking employment) divided by the Civilian Noninstitutional Population], and the 4.6% Unemployment Rate (Unemployed divided by Labor Force).
Five year window…
First we'll look at the monthly change over the next five years (from January 2013 – December 2017)
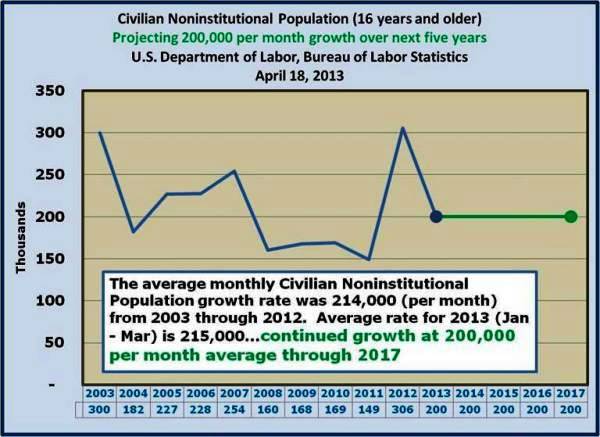
Let's say that the Civilian Noninstitutional Population will rise, on average, 200,000 per month over the next five years (2013–2017, or 60 months). The net change in the Civilian Noninstitutional Population would be 12,000,000.
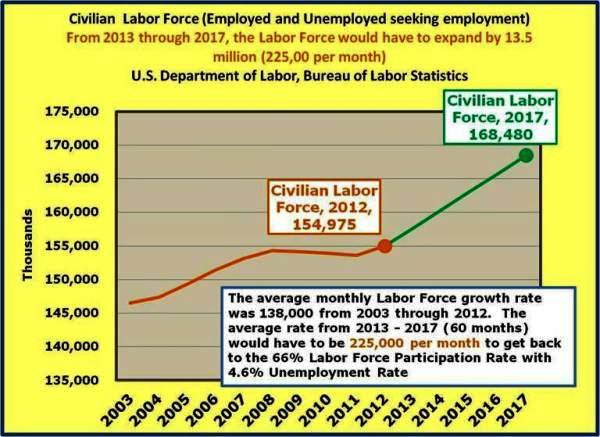
Considering that we are looking at 200,000 per month growth in the Civilian Noninstitutional Population and the target is 66% Labor Force Participation Rate, which would result in a monthly expansion in the Civilian Labor Force by 132,000 (200,000 X 66%). The net change in the Civilian Labor Force would be 7,925,000.
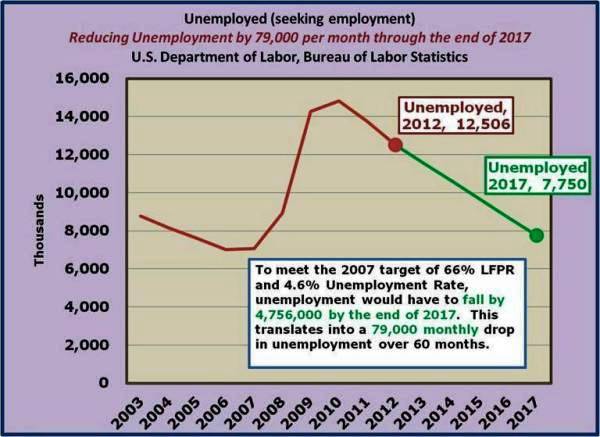
Targeting a 4.6% Unemployment Rate (Unemployed / Labor Force), the monthly average unemployed would be 6,072 and 364,538 total over the 60 months from April 2013. In addition to the
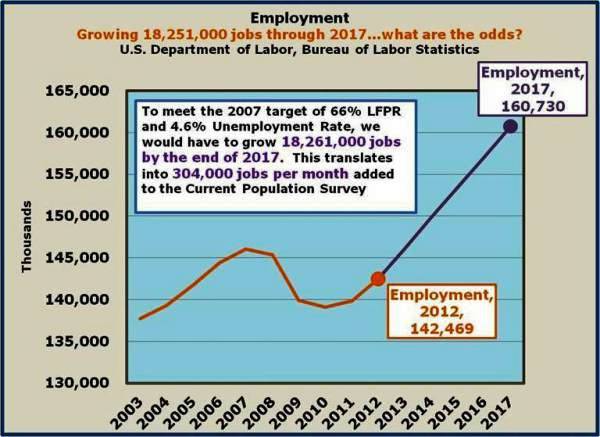
To meet the 2007 target of 66% LFPR and 4.6% Unemployment Rate, we would have to grow 18,251,000 jobs through 2017. This translates into 304,000 jobs per month added to the Current Population Survey (Household Survey) for the 60 month period, January 2013 through December 2017. Included in the Employed would grow by 126,000 per month for a total of 7,560,000 for same time frame.
Let's summarize where we're at…
We're assuming an average growth in the Civilian Noninstitutional Population of 200,000 over through 2017. In April 2013 we saw 180,000 for the month.
In order to achieve the targeted 66% Labor Force Participation Rate, we're looking at an average growth in the Civilian Labor Force of 225,000 per month for the next 60 months (January 2013 – December 2017). In April 2013 we had an expansion of 210,000 for the month.
Next, in the employment arena we need 304,000 per month. In April, we saw the employed number rise by 293,000.
Lastly, we're targeting 79,000 per month reduction in the unemployed. In April, we saw a fall-off of 83,000.
To wrap it up, as long as we can maintain the performance in the labor markets we saw in April 2013 for the next several years, we'll be in good shape. One month does not a trend make, but we are on the right path.
