2016 Volume Issue 5
Economic Newsletter for the New Millennium
March 10, 2016
For a downloadable version, click the following:
…a bit more compressed version of the PDF
February 2016 Employment Report: five months of movement back into the Labor Force
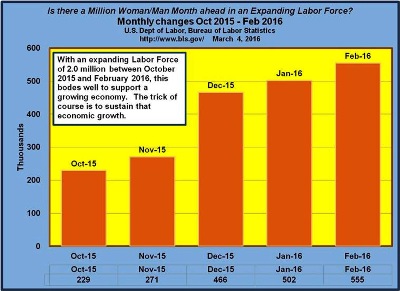
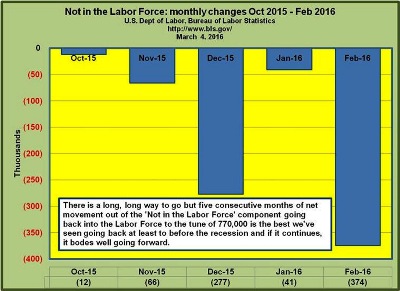
There’s a long way to go, but there are signs of life in the Labor Markets for the first time in years: 770,000 people moved from the sidelines (‘not in the Labor Force’) back into the labor force since October 2015
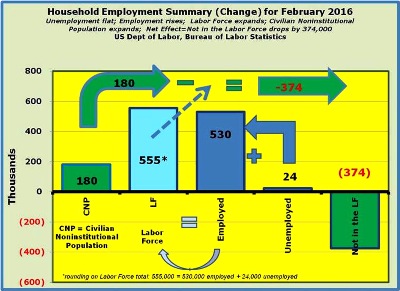
The February 2016 Employment Situation Report was very good, with the Labor Force expanding by 555,000*. The monthly change in the labor force is equal to the monthly change in employment of 530,000 plus the monthly change in unemployment (not employed, but actively seeking employment) of 24,000.
*rounding on Labor Force total: 555,000 = 530,000 employed + 24,000 unemployed
www.bls.gov/news.release/archives/empsit_03042016.pdf
The Employment Situation for the month of February 2016 in Review
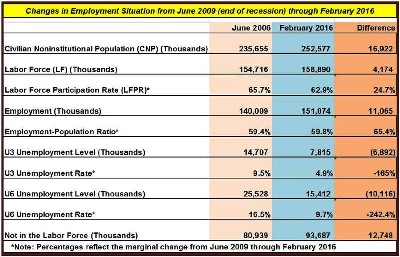
In the month of February 2016, the employment situation improved significantly. While it will take years of sustained growth going forward to make this permanent, we are certainly moving in the right direction. Digging into the numbers, we find that the Civilian Noninstitutional Population (CNP: including the segment of the total population which is 16+ years of age who are not included in the various institutional populations such as the military, prisons, etc.) grew by 180,000. The CNP number is estimated, but typically ranges from 180,000 to 225,000 on a monthly basis. Keep in mind that there is no upper age limit on the CNP, so this captures retirees as well.
The Labor Force includes that portion of the CNP which is either employed or unemployed, but actively seeking employment (U3, or ‘official’ unemployment level). When the monthly Labor Force change is less than the Civilian Noninstitutional Population amount, then there is a net outflow from the Labor Force; conversely, when the number is greater than the CNP, as was the case in February 2016 with 555,000 being added to the Labor Force, then there is a net outflow from the ‘not in the labor force’ component of the CNP.
The Labor Force Participation Rate (LFPR) measures the relationship of the Labor Force divided by the Civilian Noninstitutional Population. Going back to prerecession levels (2000 -2008) the Labor Force Participation Rate had been in the 66.0% range. After reaching a nearly 40 year low in September 2015 of 62.4%, the Labor Force Participation Rate has rebounded to 62.9%. There’s a long way to go to get back to the pre-recession level, but there are certainly signs of improvement.
Employment grew by 530,000 in February 2016. When we reference to Employment Situation, this uses data drawn from the Current Population Survey. The Current Population Survey (CPS) and the Current Employment Statistics (CES) both measure changes in Employment. While the CPS is smaller in size than the CES (also referred to as the Payroll Survey), it covers a wider swath of the population than the latter.
Understanding the employment measures from the CPS and CES Surveys
www.bls.gov/opub/mlr/2006/02/art2full.pdf
Labor Force Statistics from the Current Population Survey (CPS)
The Current Population Survey (CPS) is a monthly survey of households conducted by the Bureau of Census for the Bureau of Labor Statistics. It provides a comprehensive body of data on the labor force, employment, unemployment, persons not in the labor force, hours of work, earnings, and other demographic and labor force characteristics. Current Population Survey, a sample of 60,000 households; data are collected by personal and telephone interviews. Basic labor force data are gathered monthly; data on special topics are gathered in periodic supplemental surveys.
CES or Current Employment Statistics www.bls.gov/ces/
Each month the Current Employment Statistics (CES) program surveys approximately 146,000 businesses and government agencies, representing approximately 623,000 individual worksites, in order to provide detailed industry data on employment, hours, and earnings of workers on nonfarm payrolls.
The Employment Population Ratio measures those Employed divided by the Civilian Noninstitutional Population (CNP). The significance of the ratio is that it provides insight into how many people are rowing the boat. For February 2016, the Employment Population Ratio was 59.8%. It was as low as 58.2% as recent as November 2010, so there have definitely been signs of improvement. The objective would be to get back to the prerecession 62 to 63% range.
With all of the growth in employment, it would be reasonable to expect a fall-off in the Unemployment level; this was not the case in February 2016 as Unemployment actually increased by 24,000. While on the surface this may seem counterintuitive or at least puzzling, it was simply a case of ‘Encouraged Workers’ streaming back in from outside of the labor force. The U3, or ‘official unemployment level’ measures those in the labor force who are not employed, but are actively seeking employment. If the unemployed had risen to the point where the unemployment rate had gone up, holding the employed constant, this would have expanded the labor force even further and been a signal for even stronger job growth.
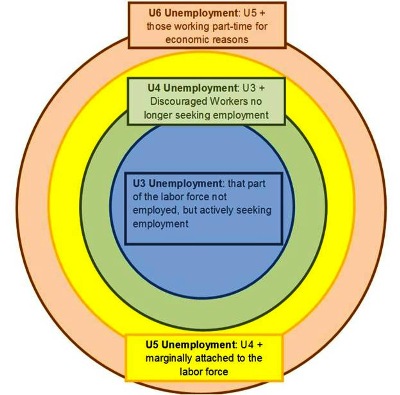
The U6 measure of unemployment (underemployment) includes the U3 folks (not employed, but actively seeking employment) along with those who are discouraged (non U3 component of U4), marginally attached (non U4 component of U5), and those who are working part-time for economic reasons (non U5 component of U6). The U6 Unemployment number is not published, but the U6 Unemployment rate is www.bls.gov/news.release/empsit.t15.htm.
The U3 Unemployment Rate measures that portion of the labor force that is not employed but actively seeking employment divided by the total Labor Force (employed + unemployed). In spite of an increase of 24,000 In February 2016 the U3 Unemployment Rate actually fell slightly (from 4.92% in January to 4.18% in February). This occurred because the labor force expanded by such a large number, with most of them finding employment. It’s entirely possible that the unemployment rate could rise in the next few months if the economy truly grows in a more robust manner. This phenomenon, the ‘Encouraged Worker Effect’ occurs when the people leave the ‘not in the labor force’ component of the Civilian Noninstitutional Population to seek employment opportunities. The prospect of job opportunities adds to the labor force and the unemployment level and rate often rises for a short period.
The U6 Unemployment Rate is a better measure of the health of the labor markets because in addition to the U3 rate (not employed, actively seeking employment), it also takes into account those people who are discouraged, marginally attached, and those who are working part-time for economic reasons. While the U3 Unemployed was 7.8 million and the U3 Unemployment Rate was 4.9%, the U6 Unemployed level was 15.4 million and the U6 Unemployment Rate was 9.7%.
The ‘Not in the Labor Force’ component of the Civilian Noninstitutional Population (CNP) is simply the CNP - Labor Force (LF). The good news is that 374,000 people returned to the Labor Force from the ‘not in the labor force’ plus an another 180,000 that were added to the CNP also ended up in the labor force rather than ending up on the sidelines in the not in the labor force as had been the case very often over the past several years.
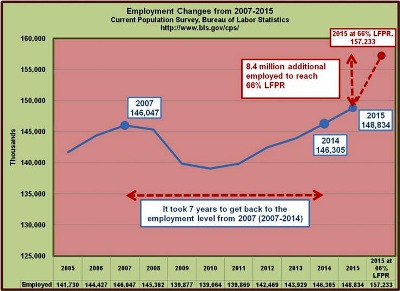
Changes in the Employment Situation since the end of the Recession - June 2006
June 2015 - Encouraged Worker Effect
www.econnewsletterjun052015.com/
Note: according the NBER - National Bureau of Economic Research www.nber.org/cycles.html, the recession went from December 2007 - June 2009 --- go figure
Since the end of the Great Recession in June 2006, there has been much confusion concerning the employment picture. While the unemployment levels and unemployment rates (U3 and U6) have fallen significantly and have nearly returned to normal and employment has expanded as well, the problem lays in the fact that that so many of those unemployed moved out of the labor force altogether on a net basis.
We have been pointing out various aspects of weaknesses in the labor markets for the several years in this newsletter, but it really hasn’t been until this very month that we’ve noticed what might be an indication that things might be improving. As we’ve also indicated, any substantial and sustained recovery in the labor markets is dependent on a number of factors, including more robust economic growth, rational monetary policy, and international considerations ranging from exchange rates to improved economic growth.
We will be looking into the exchange rate issue and trade balance in a soon to follow newsletter article.
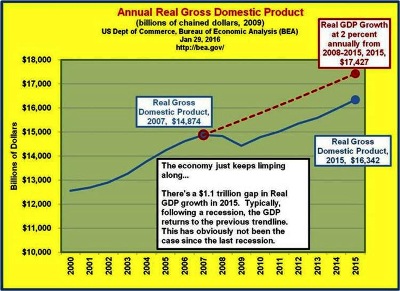
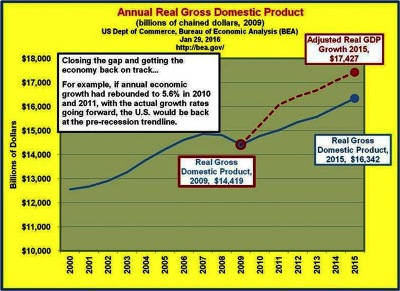
As we noted in the last newsletter article on the GDP Gap from February 21, 2016 it’s imperative that economic growth returns to the prerecession trend line…
The Gross Domestic Product (GDP) Gap: $1.1 trillion Real GDP; $1.6 trillion Nominal GDP
www.econnewsletterfeb212016.com/
Improvement in Labor Markets from October 2015 - February 2016: is this the beginning of the recovery we’ve looking for, or just another false start?
From October 2015 through February 2016, the Civilian Noninstitutional Population grew by 1.25 million or 250,000 per month.
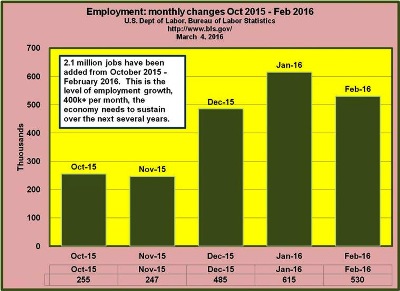
In the meantime, the Labor Force grew by 2.0 million or 405,000 per month. This labor force expansion included: Employment growth of 2.1 million, or 426,000 per month; marginal growth of the Labor Force Participation Rate of 162%, marginal Employment-Population Ratio growth of 170%; and a drop in Unemployment (U3) of 110,000, or 22,000 per month.
Lastly, the ‘Not in the Labor Force’ component of the CNP fell 770,000 from October 2015 through February 2016, or 154,000 per month.
We will be wrapping up our series on macroeconomic performance shortly with a look at inflation, but we will also be delving into other topics including the effect foreign exchange has on the domestic economy…stay tuned, but in the meantime be sure to scroll through the following charts and consider what might affect labor markets going forward.