
2011 Volume Issue 9
November 16, 2011
For a downloadable version, click the following:
ALL RIGHT, ALREADY!
WE CURRENTLY HAVE IN EFFECT ALL THOSE TAX SCHEMES BEING PROPOSED BY BOTH SIDES OF THE AISLE OF CONGRESS.
Huh? Prove it you say…we will now do just that.
To add to the pot of tax controversy, we are nearly abreast of Europe in terms of the total tax burden borne by U. S. taxpayers. First of all, let's briefly look at the total tax burden and expenditure burden on Americans in respect to each and all levels of government in the U.S. of A. Then, we will compare these burdens with those of other nations. Finally, we will show how the various taxes are a mixture of a flat tax rate, soak the rich "progressive' taxes, higher taxes on single persons, higher taxes on those married, etc. You name it and we have a tax conforming to each tax scheme being bandied and bantered about. As the terms go in public finance theory, we have taxes that violate horizontal equity and taxes that violate vertical equity; we have taxes heaped upon taxes.
Of course, don't forget that we have a hidden burden similar to a tax burden on all of us, the budgetary deficit and rising debt of the federal government and an increasing number of state and local governments as we shall examine in later articles on this web site. The burden from government deficits has several ramifications. If the FED (Federal Reserve System, our central bank) accommodates the fiscal policy of the federal government by purchasing U.S. Government securities, the monetary base will increase. This increases the capacity of the depository institutions (commercial banks, credit unions, savings banks, and savings and loan associations to create money (overwhelmingly the checkable deposit form of M1 money) and credit.
The Money Supply and those (supposedly) Overworked Printing Presses
www.econnewsletter.com/jan142011.html
IS THE FED TIGHTENING THE SCREWS ON BANK LENDING?
…risk based capital ratios reconsidered
www.econnewsletter.com/jul162011.html
As we have been observing for nearly three years now, the depository institutions may not use (are not currently, at any rate) that capacity to create M–1 money and credit due to such reasons as the hyper–activity of the supervisory and regulatory agencies (FED, FDIC, etc.) closing and threatening to close depositories, especially commercial banks. In this case, the excess capacity created by the open market operations of the FED (FOMC) is not utilized and shows up as excess reserves.
THE GREAT CREDIT COLLAPSE OF 2008–2011:
The Smoking Howitzer
www.econnewsletter.com/may182011.html
At other times when conditions were more conducive to the depositories creating new money and credit, accommodation of the federal government"s deficits by the FED lead to accelerated money and credit creation and an uptick in inflationary pressures.
When the Federal Reserve System (FED) is not accommodating the federal government's fiscal policy, and the economy is relatively close to full employment, which is definitely NOT the case at the present time with the U–6 unemployment hovering around 16%, it would result in upward pressure on interest rates and the possibility of crowding out (reducing interest sensitive spending such as business investment, housing, and perhaps consumer durable goods such as motor vehicles).
AUGUST [2011] EMPLOYMENT REPORT ––– MAKING SAUSAGE ON LABOR DAY WEEKEND
www.econnewsletter.com/sep032011.html
Of course there is also the inter–generational effect of a rising national debt that must be serviced by future generations. Lastly, there is also the rising threat of sovereign default by the federal government and the rising risk premium imbedded in the rising interest rates on the federal debt and perhaps many other type of securities as a result.
…and now presenting – the data
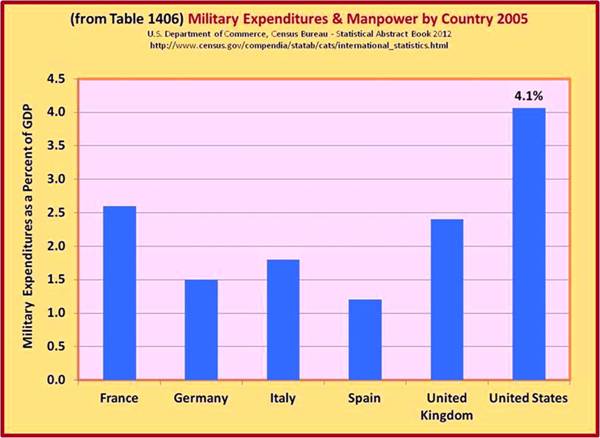
We will now turn to the data. First, let's examine the debt of the U.S. and other nations and its growth from 1993 to 2010. Much of the following data is presented in absolute dollars as well as a percent of a larger figure such as GDP or National Income. Data on military spending is included as the threat of nuclear proliferation once again rears its ugly head. It should be noted that as the nuclear threat of Iran rapidly increases, it is clear that only the U.S. is militarily prepared to defend the vital interests of the Western Democracies against this increasingly likely nuclear proliferation.
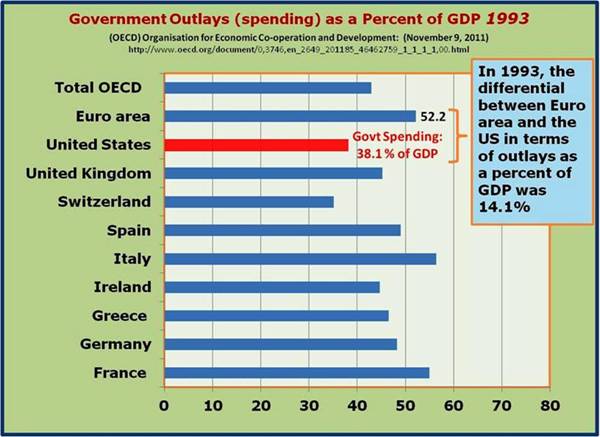
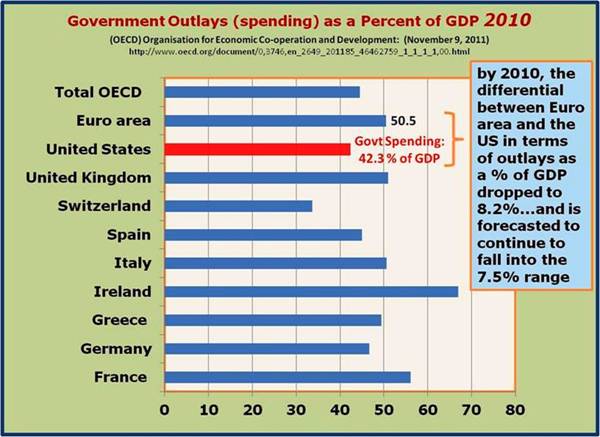
THE OVERALL TAX PICTURE AND ITS BURDEN
Much of the public [including some wannabe experts] are very confused over the tax burdens relative to this nation's overall production and income. Many use as a measure of such burdens, its ratio to (or percentage of) Gross Domestic Product or GDP whose component parts are measured at market prices with almost no imputations for goods not flowing through the market such as services produced in the home (e.g., home cooked meals, housework, DIY projects, etc.). Unfortunately, that understates the burden. The reason for this is that GDP includes in the current period's output that which is needed to replace the stock of capital goods such as structures and machinery as it wears out, breaks, or becomes obsolete. Accountants call this depreciation. The accountants at the National Income and Product Accounts (NIPA) division of the Bureau of Economic Analysis (BEA) call it Consumption of Fixed Capital (Private and Government).
Guide to NIPA
www.bea.gov/national/pdf/nipaguid.pdf
Due to the inflationary bias that has prevailed after the Great Depression, they make some adjustments to bring historical dollars up to their current value. This is done to inventories as an Inventory Valuation Adjustment or IVA. Inventories are one of the categories of business investment in the Gross Private Domestic Investment or GPDI. GPDI is one of the four components of aggregate demand, for which is why GDP is 8produced. The other three are Personal Consumption Expenditures (PCE), Government Consumption Expenditures and Gross Investment (GCE & GI), and Net exports of Goods and Services (NEGS).
(The Income Distribution: Where's the Cash?)
www.econnewsletter.com/nov182006.html
THE THEORY BEHIND THE NUMBERS – DIGGING INTO THE ACCOUNTS
Production and income are two sides of the same coin, so to speak. Production is the transformation of productive resources (labor, capital, entrepreneurship, and land) into goods and services to satisfy consumption needs and nonconsumption spending for capital accumulation, collective consumption and investment by government and exports to the rest of the world.
Income is the reward to the resources employed by a firm in the transformation process called production. These activities are measured by the Bureau of Economic Analysis (http://bea.gov/), which is a division of the Department of Commerce of the United States Government (http://www.commerce.gov/). The measurements are reflected in the National Income and Product Accounts (NIPA) and are generated quarterly and summed up annually.
In order to convert it to Gross National Product, they deduct an estimate of the contribution of foreign resources employed in the U.S. and add in an estimate of the contribution of U.S. productive resources employed in the rest of the world. The resulting figure is the Gross National Product (GNP) of the U.S. as can been seen in the table below. After subtracting Consumption of Fixed Capital (depreciation) from GNP, they arrive at Net National Product.
Now a dilemma in the NIPA arises. Changes made several years ago to arrive at National Income present a serious bias in the estimation the relative tax burden or any ratio to GDP.
Since the inception of these NIPA back in the 1930s (History of the National Income and Product Accounts (www.roiw.org/1975/153.pdf), it was argued that the majority of certain taxes, called Indirect Business Taxes (IBT), were passed forward by the firms and inflated market prices. The market prices reflected both the costs of the productive resources or factors of production as they were called in earlier times, as well as some of the taxes, the IBT (sales, excise, and property taxes). The majority of other taxes such as income taxes, corporate profit taxes, etc. were said to be passed backward and did not affect market prices of the nation's output. Formerly, the NIPA accountants at the BEA would subtract these Indirect Business Taxes from Net National Product and arrive at National Income, or the production and income of the nation at factor or productive resource prices. Then in our view, they made a change that involved a theoretical error and should be corrected, but rest assured it will not be. They began to treat all taxes, including IBTs as being passed backward to the productive resources and not forward to buyers in markets in the form of higher prices.
They continued to distinguish Net National Product from National Income by adjusting for a statistical discrepancy.
HOGWASH!
The first thing about which to be aware is that the tax burden is often measured as a ratio to or percent of taxes to GDP. The tax burden so calculated, will be less than if measured as a ratio to National Income. The major difference using the more recent calculation of the BEA between GDP and National Income is depreciation or as it is formerly called Consumption of Fixed Capital both private and Government.
This more recent treatment of Indirect Business Taxes has significant implications. It overstates the National Income and portrays National Income as a larger percent of GDP that it is in reality. What is also significant is that the tax burden expressed as a percent of National Income is higher than when expressed as a percent of GDP. By expressing the tax burden as a percent of Gross Domestic Product, the burden is misleadingly reduced. We will measure the tax burden and its component parts as percents of National Income, but keep in mind that the more recent data will reflect the error of mistreating IBTs as all being passed backward. This means that the burden even as a percent of National Income is understated due to the misleading assumption that all taxes are passed backward and paid out of income and not reflecting the reality that some of them are passed forward inflating market prices and GDP.
U.S. Department of Commerce, Bureau of Economic Analysis
National Income and Product Accounts
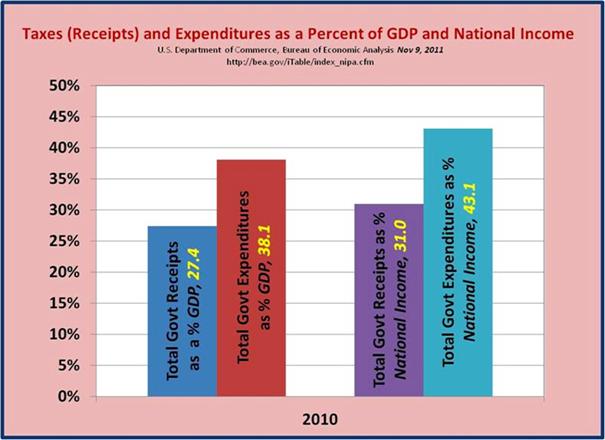
Despite these problems, a more accurate measure of the tax and expenditure burdens of households is to relate them National Income and not GDP. Again, the following bar chart clearly shows the difference.
It seems that the 9, 9, 9 tax proposal is based on the 2010 tax burden as a percent of GDP. If the 2010 tax burden were expressed as related to National income were used it would be 10.3, 10.3, 10.3. The expenditure burdens would be as a percent of GDP, 12.7, 12.7, 12.7; and as a percent of National Income, 14.4, 14.4, 14.4. As Louis (Satchmo) Armstrong sang so beautifully, What a Wonderful World.
Be sure to review our previous newsletter on this point of shifting the incidence of taxes forward or backward.
TAX PROPOSALS HERE, TAX PROPOSALS THERE, TAX PROPOSAL EVERYWHERE…BUT HOW DO WE ANALYZE THEM?
www.econnewsletter.com/jan142011.html
…one guess is probably as good as another and perhaps the assumption as to who on average bears the corporate profits tax would be one–third of the final burden resting on the buyers (higher prices), one–third on the equity capitalists (stockholders in the form of lower dividends), and one third on the other productive resources such as labor (reduced wages/compensation). Imagine that, labor ultimately bearing one–third of a corporate profits tax on the firm employing labor. If the firm's product is a consumer product, labor ends up ultimately another significant portion of the firm's profits when the worker purchases the product in question.
This is fertile grounds for conspiracy theorists!
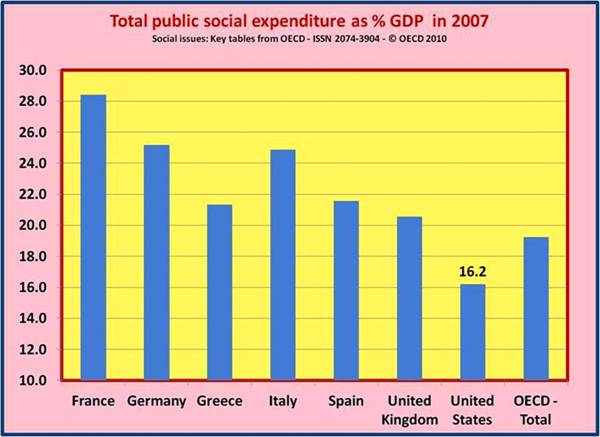
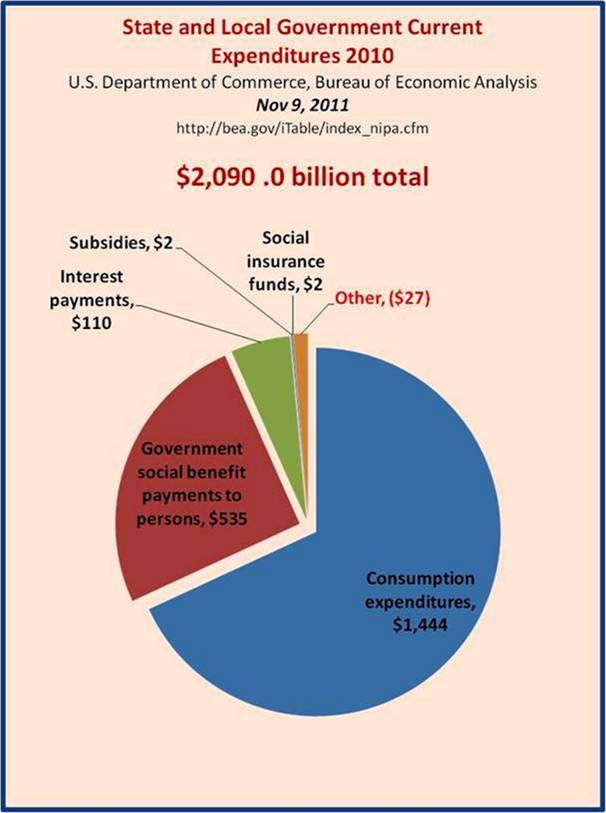
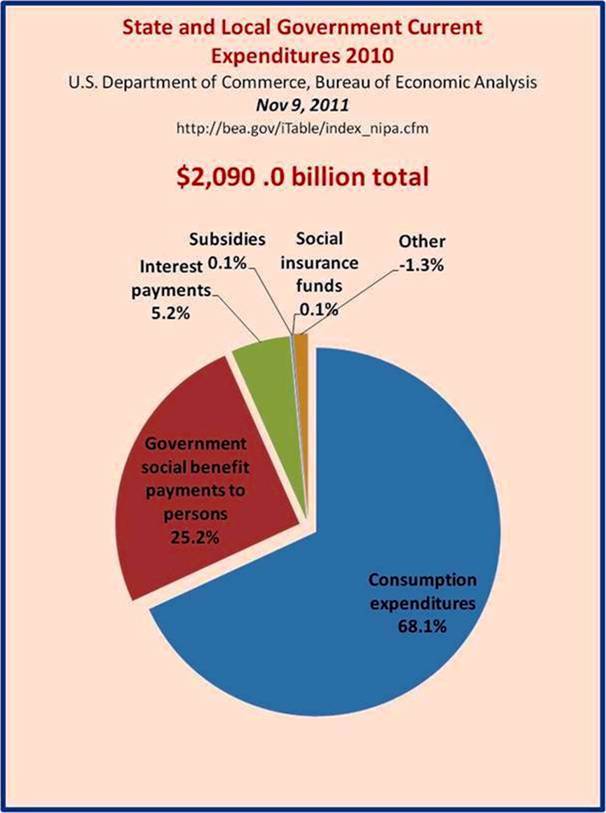
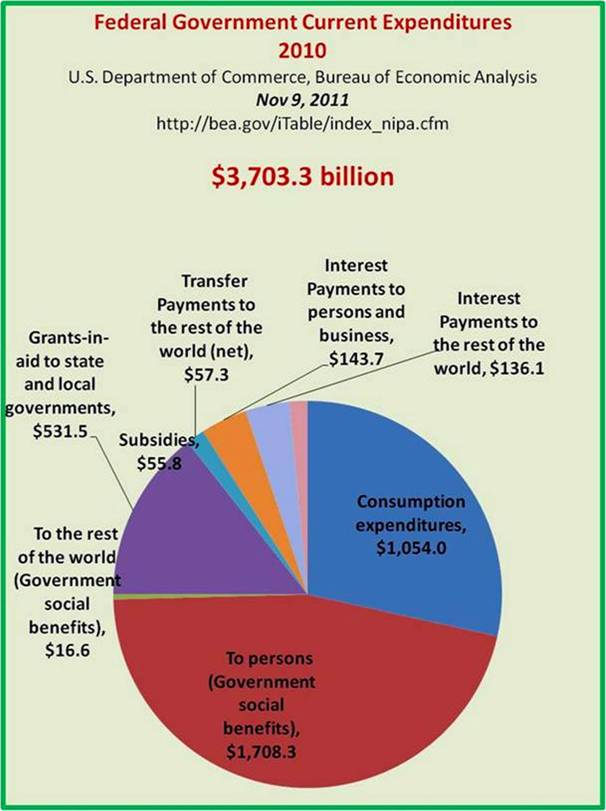
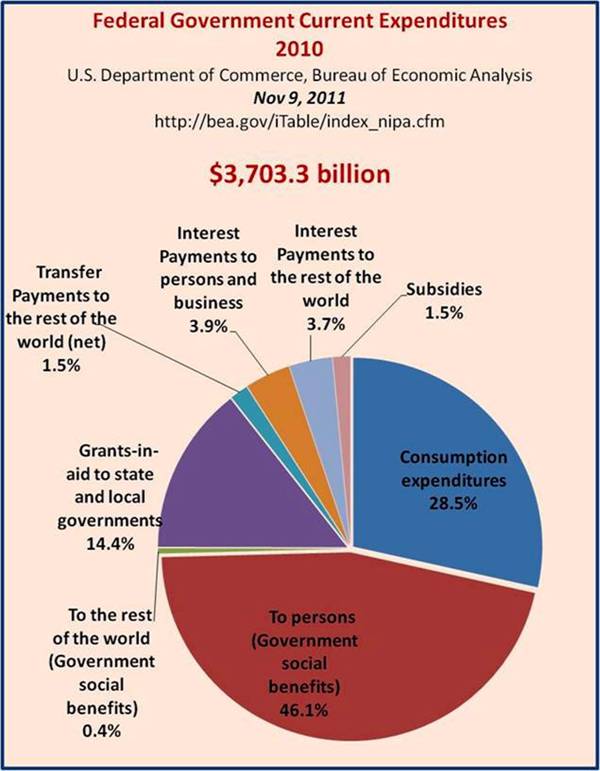
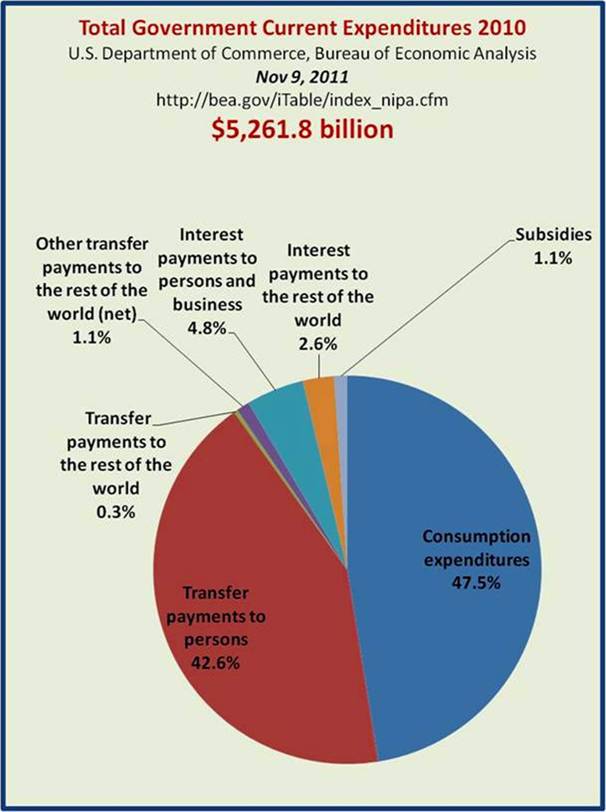
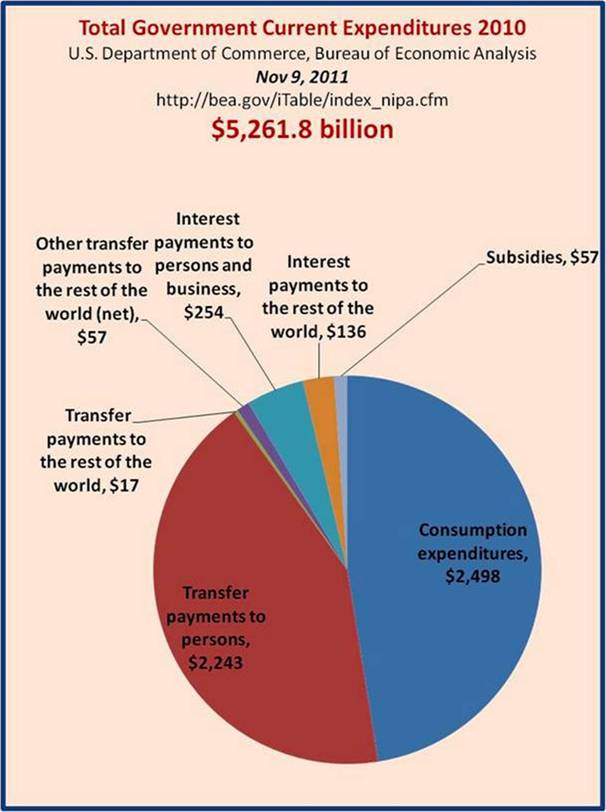
THE OVERALL BURDEN OF GOVERNMENT EXPENDITURES
In some ways the government expenditure burden is more insightful than is the tax burden. Remember that scarcity is a reality. When goods and services are produced, scarce productive resources are required and other potential goods and services are sacrificed. This is called an opportunity cost and is just as real as are so called out of pocket costs. As I tell my children, here is $50. Spend it wisely. While I am paying for it, the cost to you of the rock concert is what you cannot buy because you used the money to buy the rock concert tickets. That is the meaning of an opportunity cost, and it is real.
NOTHING IS NEW UNDER THE SUN…
How are the recent tax schemes arising over the past several years and in the current political debates already part of the current tax structures of federal, state and local governments? To that we now turn.
A FLAT TAX ON WAGES
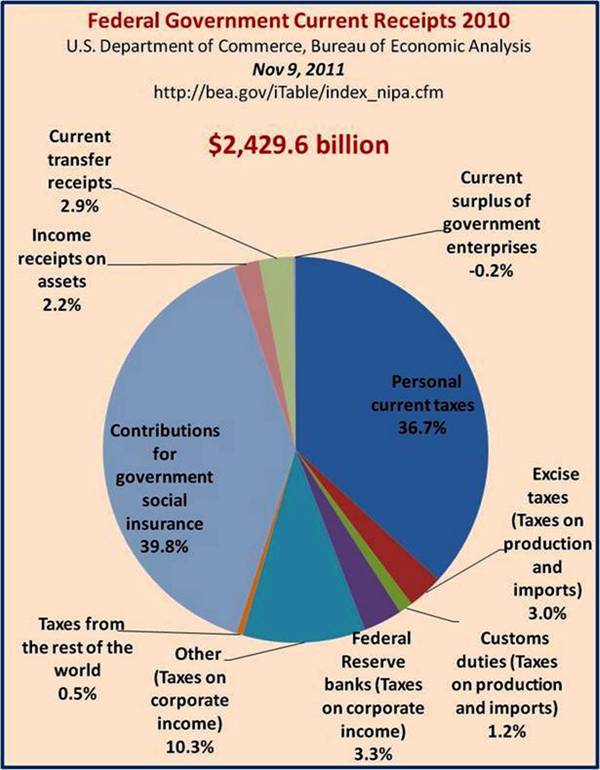
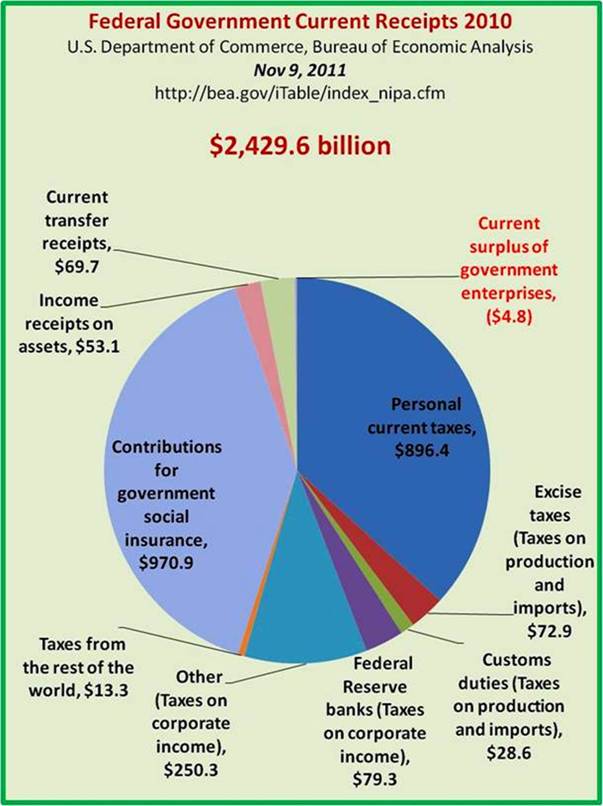
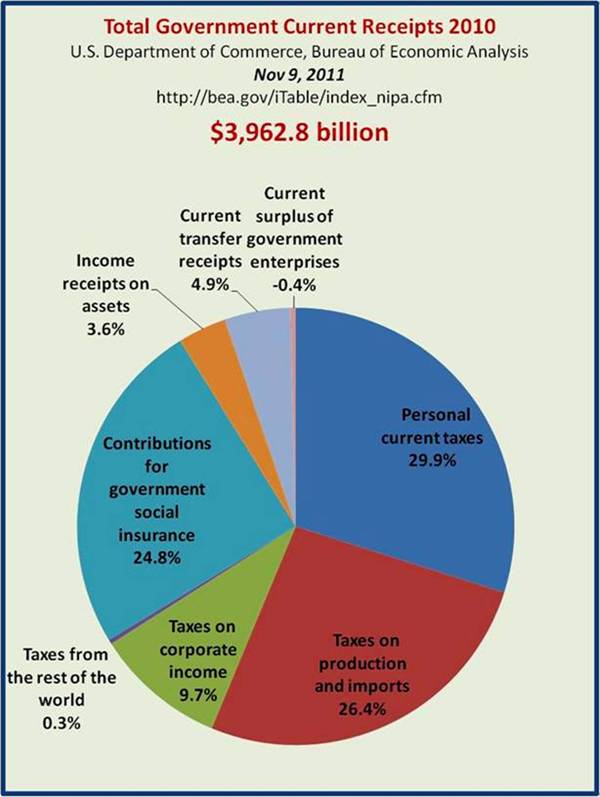
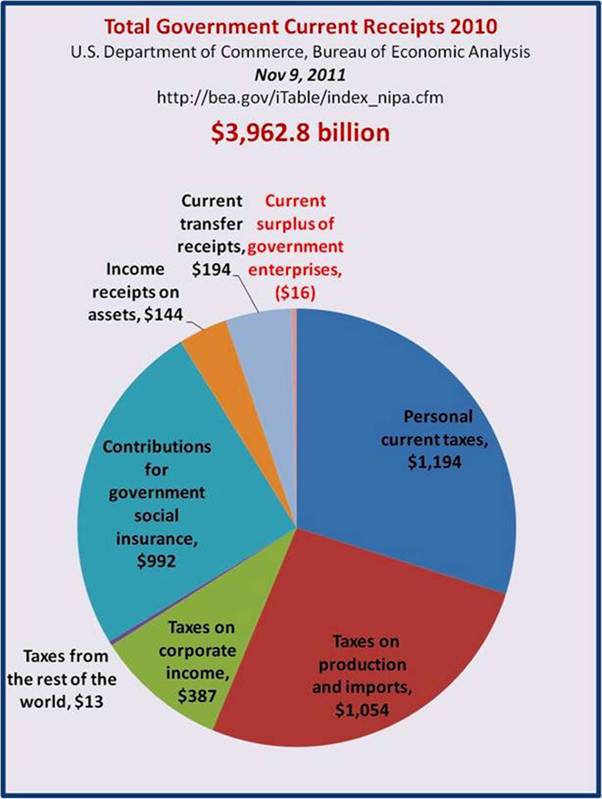
The Social Security Tax embodies a flat tax rate on both the employee and the employers (if you're lucky enough to be both – self–employed, you see the whole enchilada). It is 6.2% on each (12.4% total) up to a cap of $106,800 (it adjusts annually). From the above charts it can be seen that in 2010 it totaled $971 billion or 39.8% of all federal government receipts making it the largest tax source for the federal government, even greater than the personal income tax.
Medicare is 1.45% on all wages [2.9% total, or 1.45% on employee and 1.45% on employer…not capped (no limit)].
State income taxes (where there are state income taxes) are typically flat taxes, with exemptions (Michigan's is 4.35%, though it was supposed to be rolled back to 4.25% ––– now scheduled to be rolled back in 2012…we'll see).
Check out the tax increases ––– err, changes in Michigan – coming soon
Income Tax Changes for Individuals and Trusts
State Unemployment Tax Assessment (SUTA) – employer pays various levels, based on experience (looking back to the previous year) to determine the percentage. Federal Unemployment Tax Assessment (FUTA) – currently 6.2% (with a credit based on your SUTA) – again employer paid; keep in mind that when the employer pays, the ultimate burden lies elsewhere.
A FLAT TAX ON PURCHASES BY CONSUMERS
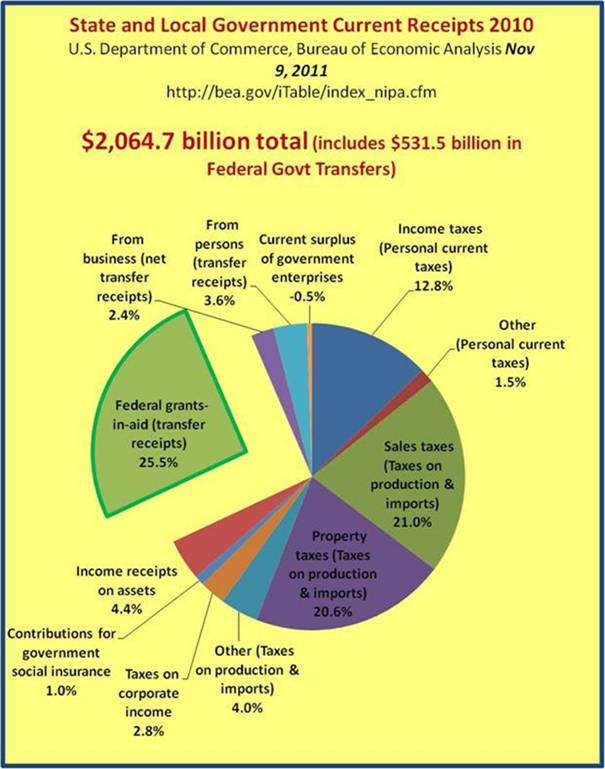
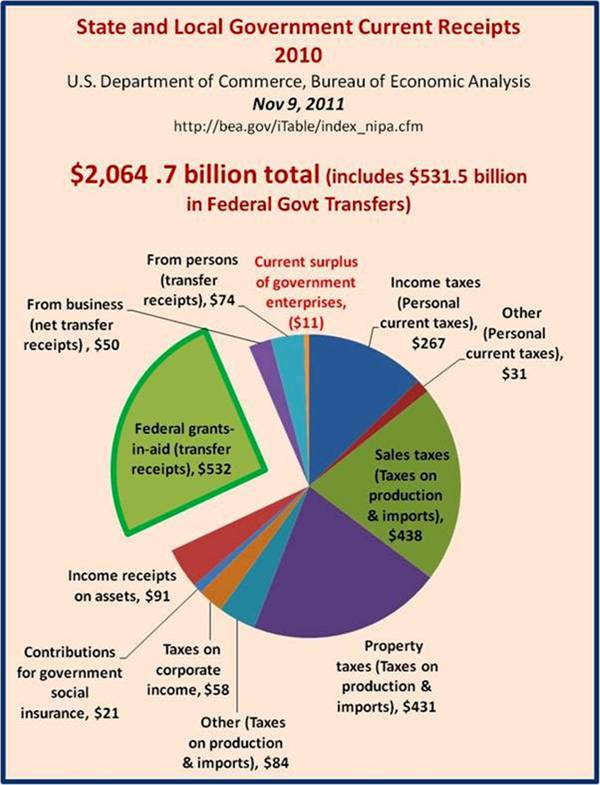
The sales tax is an important source of revenue to state and some local governments. Data for the fiscal year 2011 for all state and local governments s was $438 billion or 21% of total state and local government tax revenue. These taxes are usually flat rates on purchases.
FLAT RATE TAX ON INCOME STATE AND LOCAL GOVERNMENT LEVEL
(SEE BELOW)
Sales taxes are regressive taxes. This means that the lower the income of the tax payer, the higher total sales taxes paid are as a percent of that the taxpayers income. This is due to the fact that cross–sectional data shows that the lower the income the higher the percent of income spent on consumption upon which the sales taxes are levied. To lessen the regressivity of the sales tax, basic goods and services are typically exempt from the tax. In order to achieve a desired level of tax revenue from the sales tax, with these exemptions, the effective rate must be appreciably higher.
PROGRESSIVE OR "SOAK THE RICH' TAXES
The Federal government's income tax on individuals is said to be progressive. That means that the higher the income of the taxpayer, the higher the percentage of income paid by the taxpayer paid on that particular tax. In fact it is so progressive that many believe it violates the principle of vertical equity. Just below is a table on taxes paid by taxpayers as percents of Adjusted Gross Income or AGI. Keep in mind that there are join filers and that AGI is not quite the same as income used in the Census Bureau estimates. This data is from the IRS and excludes state and local income taxes whose degree of progressivity could be significantly different.
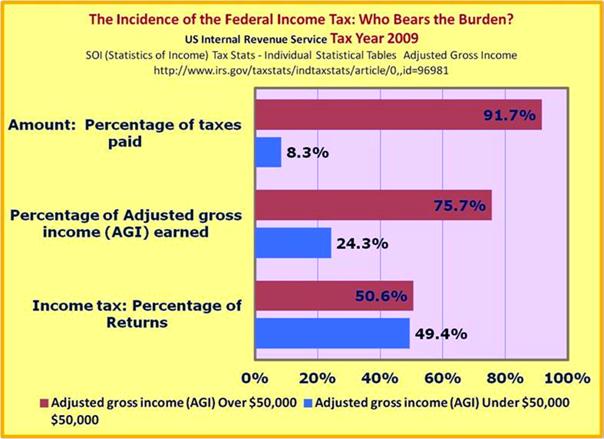
Again, in contrast, state and local income taxes are usually flat rates or proportional to the income earned. Individual income taxes constitute 36.7% of the Federal government"s receipts ($896 billion). Similar figures for all state and local governments are 12.8% and $267 billion.
Beware the return of the marriage penalty, part of the so–called Bush Tax Cuts…scheduled to be put be put back into place at the end of 2012.
www.opencongress.org/bill/112–s11/show
Official Summary
1/25/2011—Introduced
Permanent Marriage Penalty Relief Act of 2011 – Renders inapplicable the general terminating date (i.e., December 31, 2012) of the Economic Growth and Tax Relief Reconciliation Act of 2001 to provisions of that Act that eliminate the tax effect known as the marriage penalty…
www.lucas.house.gov/tax–talk–part4.shtml
The Reinstatement of the Marriage Penalty
For 2010, married couples who file jointly are taxed at the same tax rate as single individuals making exactly half their joint income. For example, in 2010 a single individual making $34,000 and a married couple jointly earning double that income, $68,000, are both taxed at the 15% level. However, beginning in 2011, the 15% tax bracket will only include married couples who have jointly earned up to $58,200, even though single individuals earning up to as much as $34,850 will still be included – meaning married couples will be taxed at a higher tax rate than if they were single.
But that's not the only problem. Currently, the standard deduction is $5700 for single individuals and $11,400 for married couples – twice the standard deduction. Under this current law, individuals are not penalized for being married with a lower standard deduction. However, beginning in 2011, that will change. The standard deduction for single individuals in 2011 will be $5800 and the standard deduction for married couples will be $9750 – $1850 less than double the deduction for a single individual. This will increase married couples' taxable incomes, making their overall tax liability higher than their single counterparts.
Watch out for deception, it is always in the detail!
