
2012 Volume Issue 21
September 4, 2012
For a downloadable version, click the following:
…a bit more compressed version of the PDF
Resuscitating the Moribund U.S. Economy
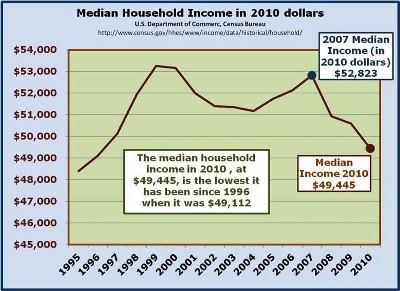
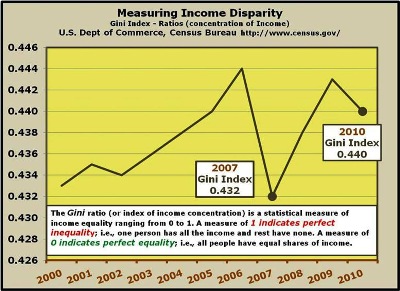
Three and one half years of stressing the importance of income redistribution instead of economic growth is enough. Instead of preventing the income levels from dropping and the preventing the income distribution from becoming less unequal and inequitable, (yes folks, there is a significant difference between the two) the income distribution picture has deteriorated and the poverty levels and rates have risen.
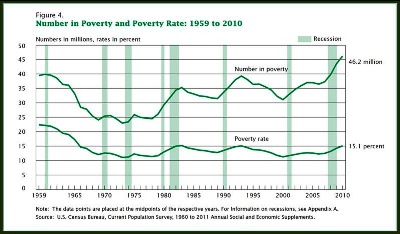
www.census.gov/hhes/www/poverty/data/incpovhlth/2010/figure4.pdf
Instead of promoting competition and enjoining or taking on monopoly (market) power, in several areas such as crude oil and its down line derivatives as well as the financial services sector, the opposite has been allowed to occur. Other areas are ignored including professional sports where the consumers (fans) are ultimately paying as much as $30 million per year for a player. In 2010, the average major league baseball player’s salary was a measly $3.3 million. That salary is pretty much on par with many over compensated Fortune 500 corporate executives who averaged “$5.6 million per executive” in 2010 and most likely many of the higher-ups in organized crime. There is no doubt that some of the major sports are very competitive (at least on the field) but the business they play in is highly cartelized. Why have the new stadiums shrunk the seating capacity? The supply has been reduced. Oh yes, my friends, less seating at each price is technically a decrease in supply. In fact, there is less seating at even higher prices.
On and on it goes. How about that heavily cartelized oil industry? Recall that from 1993 to about 2003, 15 large oil firms merged into 6.
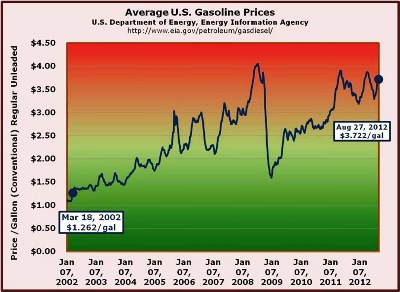
High Gas Prices – Recipe for Killing an Economic Recovery
www.econnewslettermar272012.com/
1990s --- MERGER MANIA --- higher prices today
Some of the arguments for consolidation included the desire to increase efficiencies and provide petroleum products at lower cost to the consumer…sure thing
- 1997 Ashland Oil combines most assets with Marathon Oil
- 1998 British Petroleum (BP) acquires Amoco
- 1998 Pennzoil merges with Quaker State Oil
- 1999 Exxon and Mobil join to form Exxon Mobil
- 2000 British Petroleum (BP) acquires ARCO (Atlantic Richfield)
- 2001 Chevron acquires Texaco to form Chevron Texaco
- 2002 Conoco merges with Phillips (Conoco Phillips)
- 2002 Royal Dutch Shell acquires Pennzoil-Quaker State
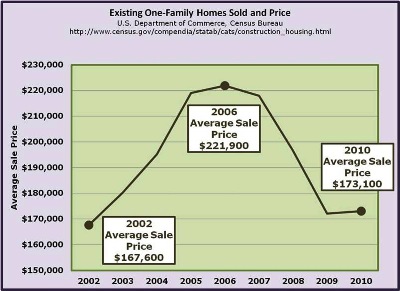
The result, a gallon of gasoline is approaching $4.00 (or more) in late 2012 instead of $1.30 as it was in 2002. That is a 200% increase despite the rapidly expanding domestic oil production at oil (and gas) shale fields such as Bakken Shale and Eagle Ford Shale. Where were and are the Anti-Trust Division of the Justice Department and the Federal Trade Commission?
It’s not only at the wellhead in the form of crude oil, but also at the refinery…
Federal Trade Commission
March 2007
www.ftc.gov/bcp/workshops/energymarkets/background/slocum_oilgas.pdf
Recent Mergers, Weak Anti-Trust Law Threaten Consumers
In just the last few years, mergers between giant oil companies—such as Exxon and Mobil, Chevron and Texaco, Conoco and Phillips—have resulted in just a few companies controlling a significant amount of America’s gasoline, squelching competition. In 1993, the largest five oil refiners controlled one-third of the American market, while the largest 10 had 55.6 percent. By 2005, as a result of all the mergers, the largest five now control 55 percent of the market, and the largest 10 dominate 81.4 percent. This concentration has led to skyrocketing profit margins.
Instead of seeking restraints on the run away collectively bargained labor contracts that are beginning to bankrupt municipalities such as San Bernardino, California and Jefferson County, Alabama, in part because of politicking for contributions, this run away sector of the productive resources markets, labor, is at best ignored and worst, encouraged. As this Great Recession (or at least its effects) continues and property prices wallow at several year lows, many municipalities are gearing up, or perhaps better said, they are gearing down for bankruptcy.
- Prichard, Alabama, 2009, due to inability to pay pensions and especially state mandated pension increases.
- Central Falls, Rhode Island, August 2011, due to inability to pay obligations, especially pensions.
- Jefferson County, Alabama, November 2011, over $4 billion in debt (largest Chapter 9 bankruptcy to date), from sewer revenue bonds tainted by a interest rate swap bribery scandal with JPMorgan and county commissioner Larry Langford, and bond insurance credit rating collapse in the late-2000s subprime mortgage crisis, followed by the occupation tax being declared unlawful in Alabama.
- Stockton, California, June 28, 2012, Stockton filed for Chapter 9 bankruptcy.
- Stockton is the largest city to file for bankruptcy in U.S. history.
- Mammoth Lakes, California on July 3, 2012
- San Bernardino, California on August 1, 2012
www.foxnews.com/politics/2012/08/24/camden-nj-to-reboot-police-department-by-new-year/
In the latest example of a cash-strapped municipality taking drastic measures to deal with swollen public sector liabilities and shrinking budgets, the city plans to disband its 460-member police department and replace it with a non-union “Metro Division” of the Camden County Police.
Our thought was to have a list of points/recommendations for turning this mess around; instead, we will just focus on one. It is government policy failure(s) obsessed with the drive to redistribute income based on poorly understood economic reasoning and resulting in an excessively unequal income distribution that give credibility to the arguments of some of the more political extreme elements.
Our recommendation:
- GROW THE ECONOMY BY CUTTING TAX RATES AND MAINTAIN PREVIOUS TAX RATE CUTS SOON TO BE SUNSETTED.
- Instead of the election campaigning focusing on tax returns of the candidates, it should be centered on the economic implications of income redistribution versus economic growth.
- Our energy policies should be focused on debating policies of increasing real employment and not on increasing tax revenues to fund failed policies.
- The political debate should be focused on reducing the inequality when such factors as market or monopoly power, in both the product (e.g., gasoline) and productive resource markets (e.g., overcompensated labor and executives), control supply to maximize profits and labor compensation at the cost to everyone of us as consumers.
While it’s bad enough that the number of employed has fallen 1.1 million since December 2008, none of the other employment measures look any better.
U.S. Department of Labor, Bureau of Labor Statistics
From December 2008 through July 2012:
Employment
- December 2008 = 143,328,000
- July 2012 = 142,220,000
- Difference = -1,108,000
Unemployment
- December 2008 = 11,299,000
- July 2012 = 12,794,000
- Difference = +1,495,000
- (U-3) Unemployment Rate (Unemployed / Labor Force)
- December 2008 = 11,299,000 / 154,626,000 = 7.3%
- July 2012 = 12,794,000 / 155,013,000 = 8.3%
- Difference = +1.0%
Civilian Noninstitutional Population
- December 2008 = 235,035,000
- July 2012 = 243,354,000
- Difference = +8,319,000
Civilian Labor Force
- December 2008 = 154,626,000
- July 2012 = 155,013,000
- Difference = +387,000
Not in Labor Force
- December 2008 = 80,408,000
- July 2012 = 88,340,000
- Difference = +7,932,000
Civilian Labor Force Participation Rate (Civilian Labor Force / Civilian Noninstitutional Population)
- December 2008 = 154,626,000 / 235,035,000 = 65.8%
- July 2012 = 155,013,000 / 243,354,000 = 63.7%
- Difference = -2.1%
For example, just looking at the U-3 Unemployment Rate and applying the same Labor Force Participation from December 2008, we would see a much higher jobless rate:
- Example of Unemployment Rate using December 2008 Labor Force Participation Rate 65.8%
- Civilian Labor Force Participation Rate (Civilian Labor Force / Civilian Noninstitutional Population)
- 65.8% (LFPR) X 243,354,000 (July 2012 Civilian Noninstitutional Population) = 160,127,000 Civilian Labor Force
- Unemployed = Civilian Labor Force – Employed
- Unemployed = 160,127,000 – 142,220,000
- Adjusted Unemployment = 17,907
- July 2012 Adjusted U-3 Unemployment Rate = 17,907 Adjusted Unemployment / 160,127,000 Adjusted Civilian Labor Force
- July 2012 Adjusted U-3 Unemployment Rate = 11.2%
U-6 Unemployment Rate
- December 2008 = 13.5%
- July 2012 = 15.0%
- Difference = +1.5%
Taking 15% of the Civilian Labor Force of 160,127,000 in July 2012 gets us to 24,019,000 total unemployed in the U-6 category.
To put things very simply, just to return to the employment picture of December 2008, with the current Civilian Noninstitutional Population in July 2012, let’s take a look:
- December 2008
- Unemployment Rate 7.3%
- Labor Force Participation Rate 65.8%
- Civilian Noninstitutional Population 243,354,000
- Civilian Noninstitutional Population 243,354,000 X Labor Force Participation Rate 65.8% = 160,127,000 Civilian Labor Force
- Unemployment Rate 7.3% X 160,127,000 Civilian Labor Force = 11,701,000 Unemployed
- 160,127,000 Civilian Labor Force - 11,701,000 Unemployed = 148,426,000 Employed.
- Adjusted Employed 148,426,000 - July 2012 Employed 142,220,000 = 6,206,000 fewer employed than needed to be at 7.3% Unemployment Rate and 65.8% Labor Force Participation Rate
We need economic policies to return the nation to the pre-financial crisis status, a crisis in which we continue to wallow. Assuming we could live with a 7.3% Unemployment Rate and 65.8% Labor Force Participation Rate, and also assuming the Civilian Noninstitutional Population expands by 150,000 per month, this would require around 280,000 new jobs per month for the next four years.
It has to be noted that extending the period for which unemployment benefits are provided is not a reasonable substitute for bringi0ng jobs back. We need to stem the gushing economic blood flowing out of the economy and swelling the ranks of those that are partially and fully dependent on government welfare.
We need more of the spirit of Adam Smith, “People of the same trade seldom meet together, even for merriment and diversion, but the conversation ends in a conspiracy against the public, or in some contrivance to raise prices,” and much less of the spirit of Saul Alinsky, “The first step in community organization is community disorganization.”
We have often quoted the philosopher, George Santayana, and his warning on what will happen to society if it does not learn the lessons of history.
As social scientists, economists must use history and the results of past economic policies as their laboratory. We cannot take people and evacuate their lungs and light a Bunsen burner and point it at their derrieres, unless we are willing to accept some hard time in our prison system.
But it can be difficult when dealing with the results of past policies. Remember the fears of first President Eisenhower and then President Kennedy as to economic stagnation. The Editor of this newsletter remembers lecturing on the distinctions made by James Duesenberry between the short-run or cross sectional consumption and the long-run or time series consumption functions. The issue at hand was economic stagnation and some argued it was due to weakening consumption as reflected in a cross sectional consumption function. At any given time, those with higher incomes spent a smaller percentage of their income than those of lower incomes, both on an average and marginal basis.
As was pointed out, when aggregate consumption was related to aggregate income over time, a different picture emerged showing a more constant marginal propensity to consume. Look elsewhere for the causes of economic stagnation, was the conclusion.
Recall the instituting of a many bracketed progressive income tax that was legislated. The tax brackets were based upon nominal income and not real or inflation-adjusted income. Then came a period of at first gradual and then more rapidly accelerating inflation and what became known as the BRACKET CREEP.
Since nominal incomes rose faster than real incomes, the tax payers CREPT into higher and higher marginal tax brackets or tax rates. As the marginal propensity to pay taxes out of income rose, the marginal propensity to undertake personal consumption expenditures, fell.
This time, economic policies worked – as the tax bracket creep was to a great extent eliminated. A major cause of economic stagnation was eliminated.
What needs to be done now is to reduce tax rates while we still have some wiggle room before the rising fear of sovereign risk overwhelms investors and eliminates our options. Current policies are sacrificing the wiggle room with increases in the national debt rising faster than the slow rate of GDP growth. The U-6 unemployment rate, the most realistic measure which includes such groups as the discouraged worker, is still at 15%. It sounds a lot like the situation under FDR in the Great Depression of the 1930s as his trusted Secretary of the Treasury, Henry Morgenthau, Jr. stated in the House Ways and Means Committee on May 9, 1939:
http://blog.heritage.org/2009/01/14/were-spending-more-than-ever-and-it-doesnt-work/
William Beach
January 14, 2009
We have tried spending money. We are spending more than we have ever spent before and it does not work.
I say after eight years of this Administration we have just as much unemployment as when we started. … And an enormous debt to boot!
http://blog.heritage.org/2010/10/20/hoover-fdr-and-clinton-tax-increases-a-brief-historical-lesson/
President Herbert Hoover asked for a temporary tax increase…in June 1932, raising the top income tax rate from 25% to 63% and quadrupling the lowest tax rate from 1.1% to 4%. That didn’t help confidence or the Treasury. Revenue from the individual income tax dropped from $834 million in 1931 to $427 million in 1932 and $353 million in 1933.
Unfortunately, President Roosevelt made the same crucial mistake President Hoover made 5 years earlier, so the recovery didn’t last. FDR convinced Congress to raise taxes sharply in 1937 in an attempt to balance the budget. Once tax increases took effect, the economy collapsed into another recession – the second stage of the double-dip which lasted into WWII.
www.econnewsletterdec232011.com/
…Revenue Act of 1932, signed into law by Herbert Hoover, individual tax rates rose from 25% to 63% at the highest level.
Likewise, FDR followed on with a relish, and with passage of the Revenue Act of 1936, the highest marginal income tax rate went to 79% while reducing exemptions and earned income credit at the lower end. By 1940 the federal corporate income tax rate rose to 24% from its 12% level in 1930. Roosevelt also signed laws introducing or raising excise taxes on dividends, a capital stock tax, liquor taxes and higher estate taxes (inter-generational transfer of wealth).
Following President Herbert Hoover’s tax increase policy in 1932 to control deficits and rising national debt, President Franklin Delano Roosevelt (FDR) ‘out-Hoovered’ Hoover. The results were dismal and what followed were massive government expenditure increases, especially on public works projects. In 1937, the economy took another dip. The inability to reduce the unemployment rate led to the above cited remarks of Henry Morgenthau in 1939. The clamor of war in Europe and then Asia and FDR’s unpopular decision referred to as Lend Lease in the face of a strongly isolationist public followed by the Japanese attack on Pearl Harbor, finally caused the economy to come back to life, so to speak, but it was really only after WWII that the economy truly sprang back to life after Congress removed many of the regulations (e.g., price controls) put in place prior to and during the conflict.
The following piece by Gene Smiley is a good read on the Depression
www.econlib.org/library/Enc/GreatDepression.html
It is commonly argued that World War II provided the stimulus that brought the American economy out of the Great Depression. The number of unemployed workers declined by 7,050,000 between 1940 and 1943, but the nu0mber in military service rose by 8,590,000. The reduction in unemployment can be explained by the draft, not by the economic recovery.
Tax rate increases are not always disruptive. As the U.S. entered the Second World War, in order to successfully pursue that war, it became an issue of guns versus butter, as it was then expressed. Peacetime goods and services had to give way to more wartime goods and services. Rationing was instituted and FDR asked Congress for huge tax rate increases and they so legislated them.
It wasn’t until the Revenue Act of 1945 was passed (cutting tax rates) by a Democratic Congress that prosperity finally returned.
Did FDR End the Depression?
Roosevelt died before the war ended and before he could implement his New Deal revival. His successor, Harry Truman, in a 16,000 word message on Sept. 6, 1945, urged Congress to enact FDR's ideas as the best way to achieve full employment after the war.
Congress—both chambers with Democratic majorities—responded by just saying "no." No to the whole New Deal revival: no federal program for health care, no full-employment act, only limited federal housing, and no increase in minimum wage or Social Security benefits.
Instead, Congress reduced taxes. Income tax rates were cut across the board. FDR's top marginal rate, 94% on all income over $200,000, was cut to 86.45%. The lowest rate was cut to 19% from 23%, and with a change in the amount of income exempt from taxation an estimated 12 million Americans were eliminated from the tax rolls entirely.
Corporate tax rates were trimmed and FDR's "excess profits" tax was repealed, which meant that top marginal corporate tax rates effectively went to 38% from 90% after 1945.
The author, Burton Folsom goes on to explain that in spite of the lower tax rates, tax revenues grew within a few years, exceeding the receipts from during the war years when rates were significantly higher.
Fast forward…
As we entered the War in Vietnam, President Lyndon Johnson similarly asked Congress for tax rate hikes and facing rising inflationary pressures received them. His problem, as has been analyzed many times over, was the temporary nature of the tax rate increases. Permanent income hypothesis supporters argued that this approach could not do the job and did not do the job of suppressing inflationary pressures although it did to some extent free up productive resources by reducing some production of peacetime goods and allow more wartime goods to be produced.
While sunset limits to tax rate changes, both upward and downward, sound good, the warning of supporters of the Permanent Income Hypothesis as to their efficacy, should be seriously considered.
The Clinton tax rate increases give evidence of the danger of permanent tax rate increases over an extended period of time. Under the insistence of Secretary of the Treasury Rubin, President Clinton asked Congress to direct significant tax increases passed in 1993, not only to eliminate budgetary deficits but to reduce the national debt in an absolute and not just in a relative sense. Congress concurred and so legislated.
Remember that tax revenues are a product of the tax rate and the tax base. The tax rate changes, especially permanent changes, have a fairly strong impact on the tax base. What is involved in this analysis of such tax rate changes is the concept of elasticity. What will be the response of the tax base to the change in tax rates?
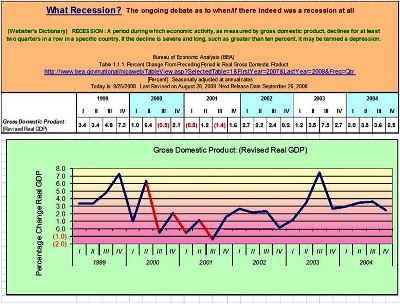
Of equal importance is the time pattern it takes for such responses to have their effects not only on the tax base but the growth rate of GDP. In this case, all seemed well from the inception of the tax rate increases until the last year of Clinton’s second term in 2000 when the economy literally collapsed. As the federal government’s deficits shrank and then turned into surpluses, the fiscal pressure exerted on the economy finally manifested itself with the growth rate moving from a positive 6.4% annualized quarterly real GDP rate in the 2nd Quarter of 2000 to a negative 0.5% in the 3rd quarter 2000.
This proved to be one of the sharpest downturns in the nation’s economic history. The incoming President Bush asked for and eventually received tax rate reductions, but with sunset limits. Here we go again, back to the efficacy of temporary tax rate changes as discussed above.
Again, the historical record gives support to (more permanent) tax rate cuts as a successful way to return the economy to recovery and growth. During the presidencies of Harding and Coolidge, and at Treasury Secretary Andrew Mellon’s urging, Congress reduced tax rates in 1921, 1924 and 1926. This succession of tax cuts resulted in a strong upturn in the U.S. economy.
www.econnewsletteraug112011.com/
Mellon proposed tax rate cuts, which Congress enacted in the Revenue Acts of 1921, 1924, and 1926. The top marginal tax rate was cut from 73% to 58% in 1922, 50% in 1923, 46% in 1924, 25% in 1925, and 24% in 1929. Rates in lower brackets were also cut substantially, relieving burdens on the middle-class, working-class, and poor households.
By 1926 65% of the income tax revenue came from incomes $300,000 and higher, when five years prior, less than 20% did. During this same period, the overall tax burden on those that earned less than $10,000 dropped from $155 million to $32.5 million.
As mentioned above, fears of economic stagnation led both Presidents Eisenhower and Kennedy to the push for lower tax burdens.
The arguments of Arthur Laffer had some influence on President Reagan as he convinced Congress on the need for tax rate reductions. The economy did well for a number of years.
www.econnewsletteraug112011.com/
Arthur Laffer argued that what was needed in then and is needed now is a decrease in tax rates in order to grow the tax base. Remember that tax revenues are equal to the tax rates times the tax base such a GDP. The ‘Reagan tax rate reductions’ and the ‘Bush II tax rate reductions’ were followed by relatively long periods of significant economic growth (Reagan in particular; note that Bush’s recovery was stalled by the financial collapse, beginning in late 2007).
