
2014 Volume Issue 1
January 2, 2014
For a downloadable version, click the following:
…a bit more compressed version of the PDF
WHAT IS BEHIND THE FEDERAL RESERVE SYSTEM’S LATEST CAUTIONARY MONETARY POLICY ACTION?
…INVESTORS, BE AWARE OF THE MINEFIELD IN TO WHICH YOU MAY HAVE WANDERED!
Marketwatch – April 3, 2013
www.marketwatch.com/story/fed-could-start-tapering-qe3-this-summer-williams-2013-04-03
John Williams, president of the Federal Reserve Bank of San Francisco
““Assuming my economic forecast holds true, I expect we will meet the test for substantial improvement in the outlook for the labor market by this summer. If that happens we could start tapering our purchases then,” Williams said in a speech to a business group in Los Angeles.”
The Financial Times – September 15, 2013
www.ft.com/cms/s/0/0410f1ac-1c9c-11e3-8894-00144feab7de.html#axzz2p5YAV4ae
“The end of quantitative easing has been declared many times since the end of the Great Recession. This week, however, the final act may truly begin.”
Rumors have abounded that the FED (Federal Reserve System, our central bank) would begin backing away from its Quantitative Easing policy. The ongoing result of a succession of these actions, or QEs, has been to drive interest rates to very low levels and keep them there for five years and counting.
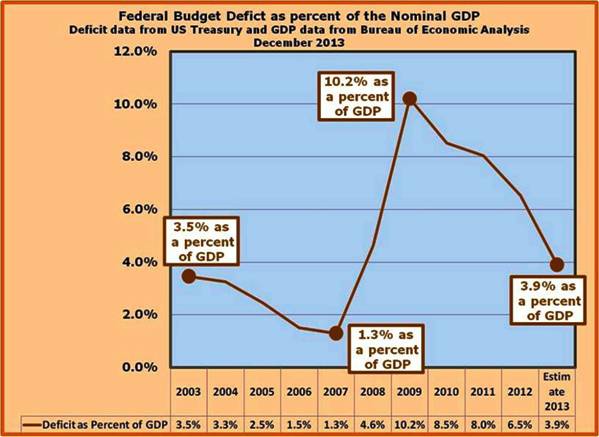
The justification for this policy of Quantitative Easing was to aid in a recovery from the financial disaster and its resulting recession of a few years ago (according to the National Bureau of Economic Research – NBER, the last recession ended in June 2009…hmmm). The many huge bail outs aided in a precipitous rise in the U.S. Federal Government budgetary deficits which increased the outstanding Federal debt substantially. In fact, it rose so much and so quickly that we began to hear the term ‘Sovereign Risk’ (the fear of the government defaulting on its debt service) being bantered about.
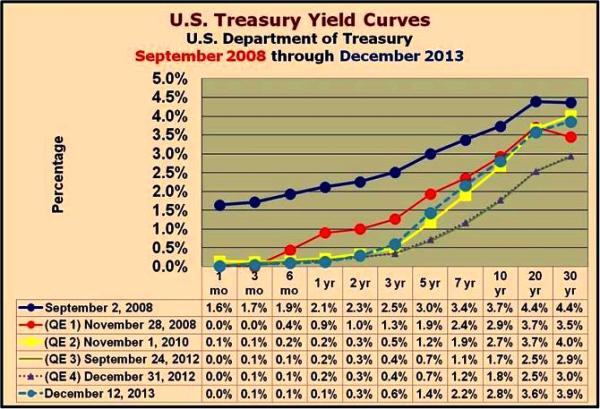
To understand how these fears came about, it would be helpful to review the Federal government’s fiscal activities from just before the financial crisis first raised its ugly head in 2007, to the present time. The following charts will help the reader see the enormity of the FED’s monetary policy intervention lovingly called, the Quantitative Easings.
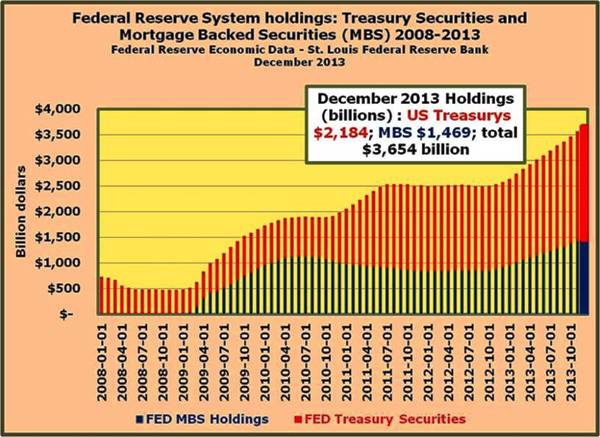
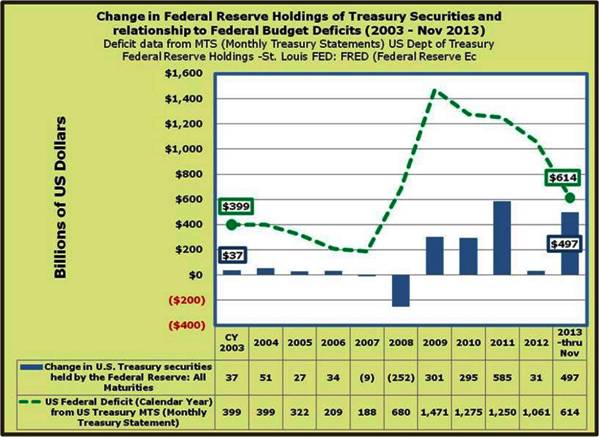
The FED is pondering the weaning off of its support of the U.S. Government and Mortgage Backed Securities segments of the financial markets. The enormous rise in the Federal Government’s debt would have led to a significant surge in what is termed a ‘Crowding Out’ of funding for private sector spending, especially in the form of very high interest rates. The resulting rise in the cost of capital despite the recession would have led to further difficulties in the business investment, housing and consumer durables segments of aggregate demand and weakened farther an already floundering economy.
Once again, the asymmetry of the FED’s ability to alter economic behavior has manifested itself. While possessing enormous power to slow down the level of economic activity, it is, as the often used expression of ‘Pushing on a Limp String’ implies, nearly powerless to speed up the level of economic activity. The last six years or so, give more proof of the asymmetry in the power of the FED’s monetary policies to change the outcome of the economy’s behavior.
The investors’ minefield that this article analyzes is due to the ever-present inverse relationship between asset prices, especially financial assets, and interest rates. This is the essence of interest rate risk which this website has examined on several occasions in the past.
Après Moi, le Deluge
July 1, 2011
www.econnewsletter.com/jul012011
“Understand that the huge supply of Federal Government marketable securities [U.S. Treasurys] puts tremendous downward pressure on the prices of these securities and therefore also puts tremendous upward pressure on the interest rates in these markets.
Several things occur as a result. As interest rates rise on these securities, the prices of existing or outstanding similar securities fall. This is the inverse relationship of interest rates to security prices phenomenon and the essence of that little understood interest rate risk.”
Why are interest rates so low?
January 12, 2012
www.econnewsletter.com/jan122012
“…low interest rates pose significant interest rate risk when the rates return to more ‘normal’ levels. Just as some made huge profits by holding debt securities when interest rates collapsed in the early 1980s, holding such securities currently could lead to wealth-killing moves in the price of debt securities when - not if - but when, interest rates return to more normal levels.”
The Federal Open Market Committee (FOMC) Rolls Along
March 20, 2013
www.econnewsletter.com/mar202013
“…the last few financial crises have shown our own central bank to favor the open market operations approach resulting in much market instability. Never forget the inverse relationship between interest rates and asset prices and the huge periodic materializing of what used to be a fairly docile interest rate risk.”
Interest rate risk is in turn composed of price risk and reinvestment risk. A composite metric of interest rate risk is called duration. We will examine in more depth this measure of interest rate risk later in this article.
An asset’s price is the discounted present value of the estimated future flow of the cash or the cash equivalent of the benefits the asset will generate to the owner. As interest rates rise, the discounted present value of the future cash flow decreases and vice versa when interest rates fall. The relationship is much tighter for such things as bonds where the cash flow is precisely spelled out and to which it is contractually agreed. The longer the time to maturity and the lower the coupon rate, the greater is the price risk portion of interest rate risk. For assets whose future flow of cash or cash equivalent benefits is less precise such as common stock or commercial property, the relationship is there but in a more approximate way.
Remember that the actual rate of discount, sometimes referred to the required rate of return, includes such things as a risk premium and an inflation premium. Also keep in mind the time value of money. The farther into the future is a cash flow, the lower its discounted present value. Also, the higher the relevant rate of discount, the lower is the discounted present value of cash or cash equivalent benefits generated by the asset in question. When markets behave rationally and efficiently, and are in equilibrium, the consensus of the discounted present values so determined should bring about the current market prices of the assets.
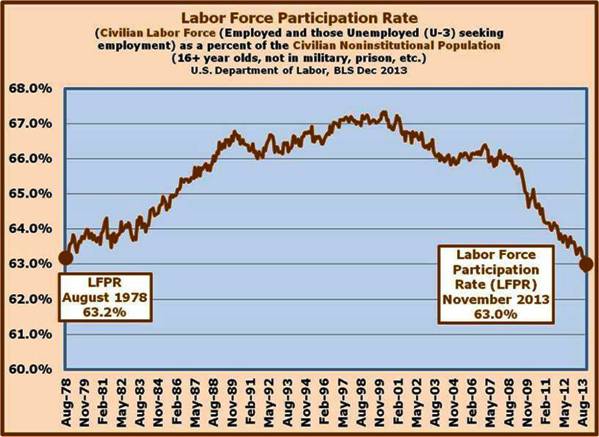
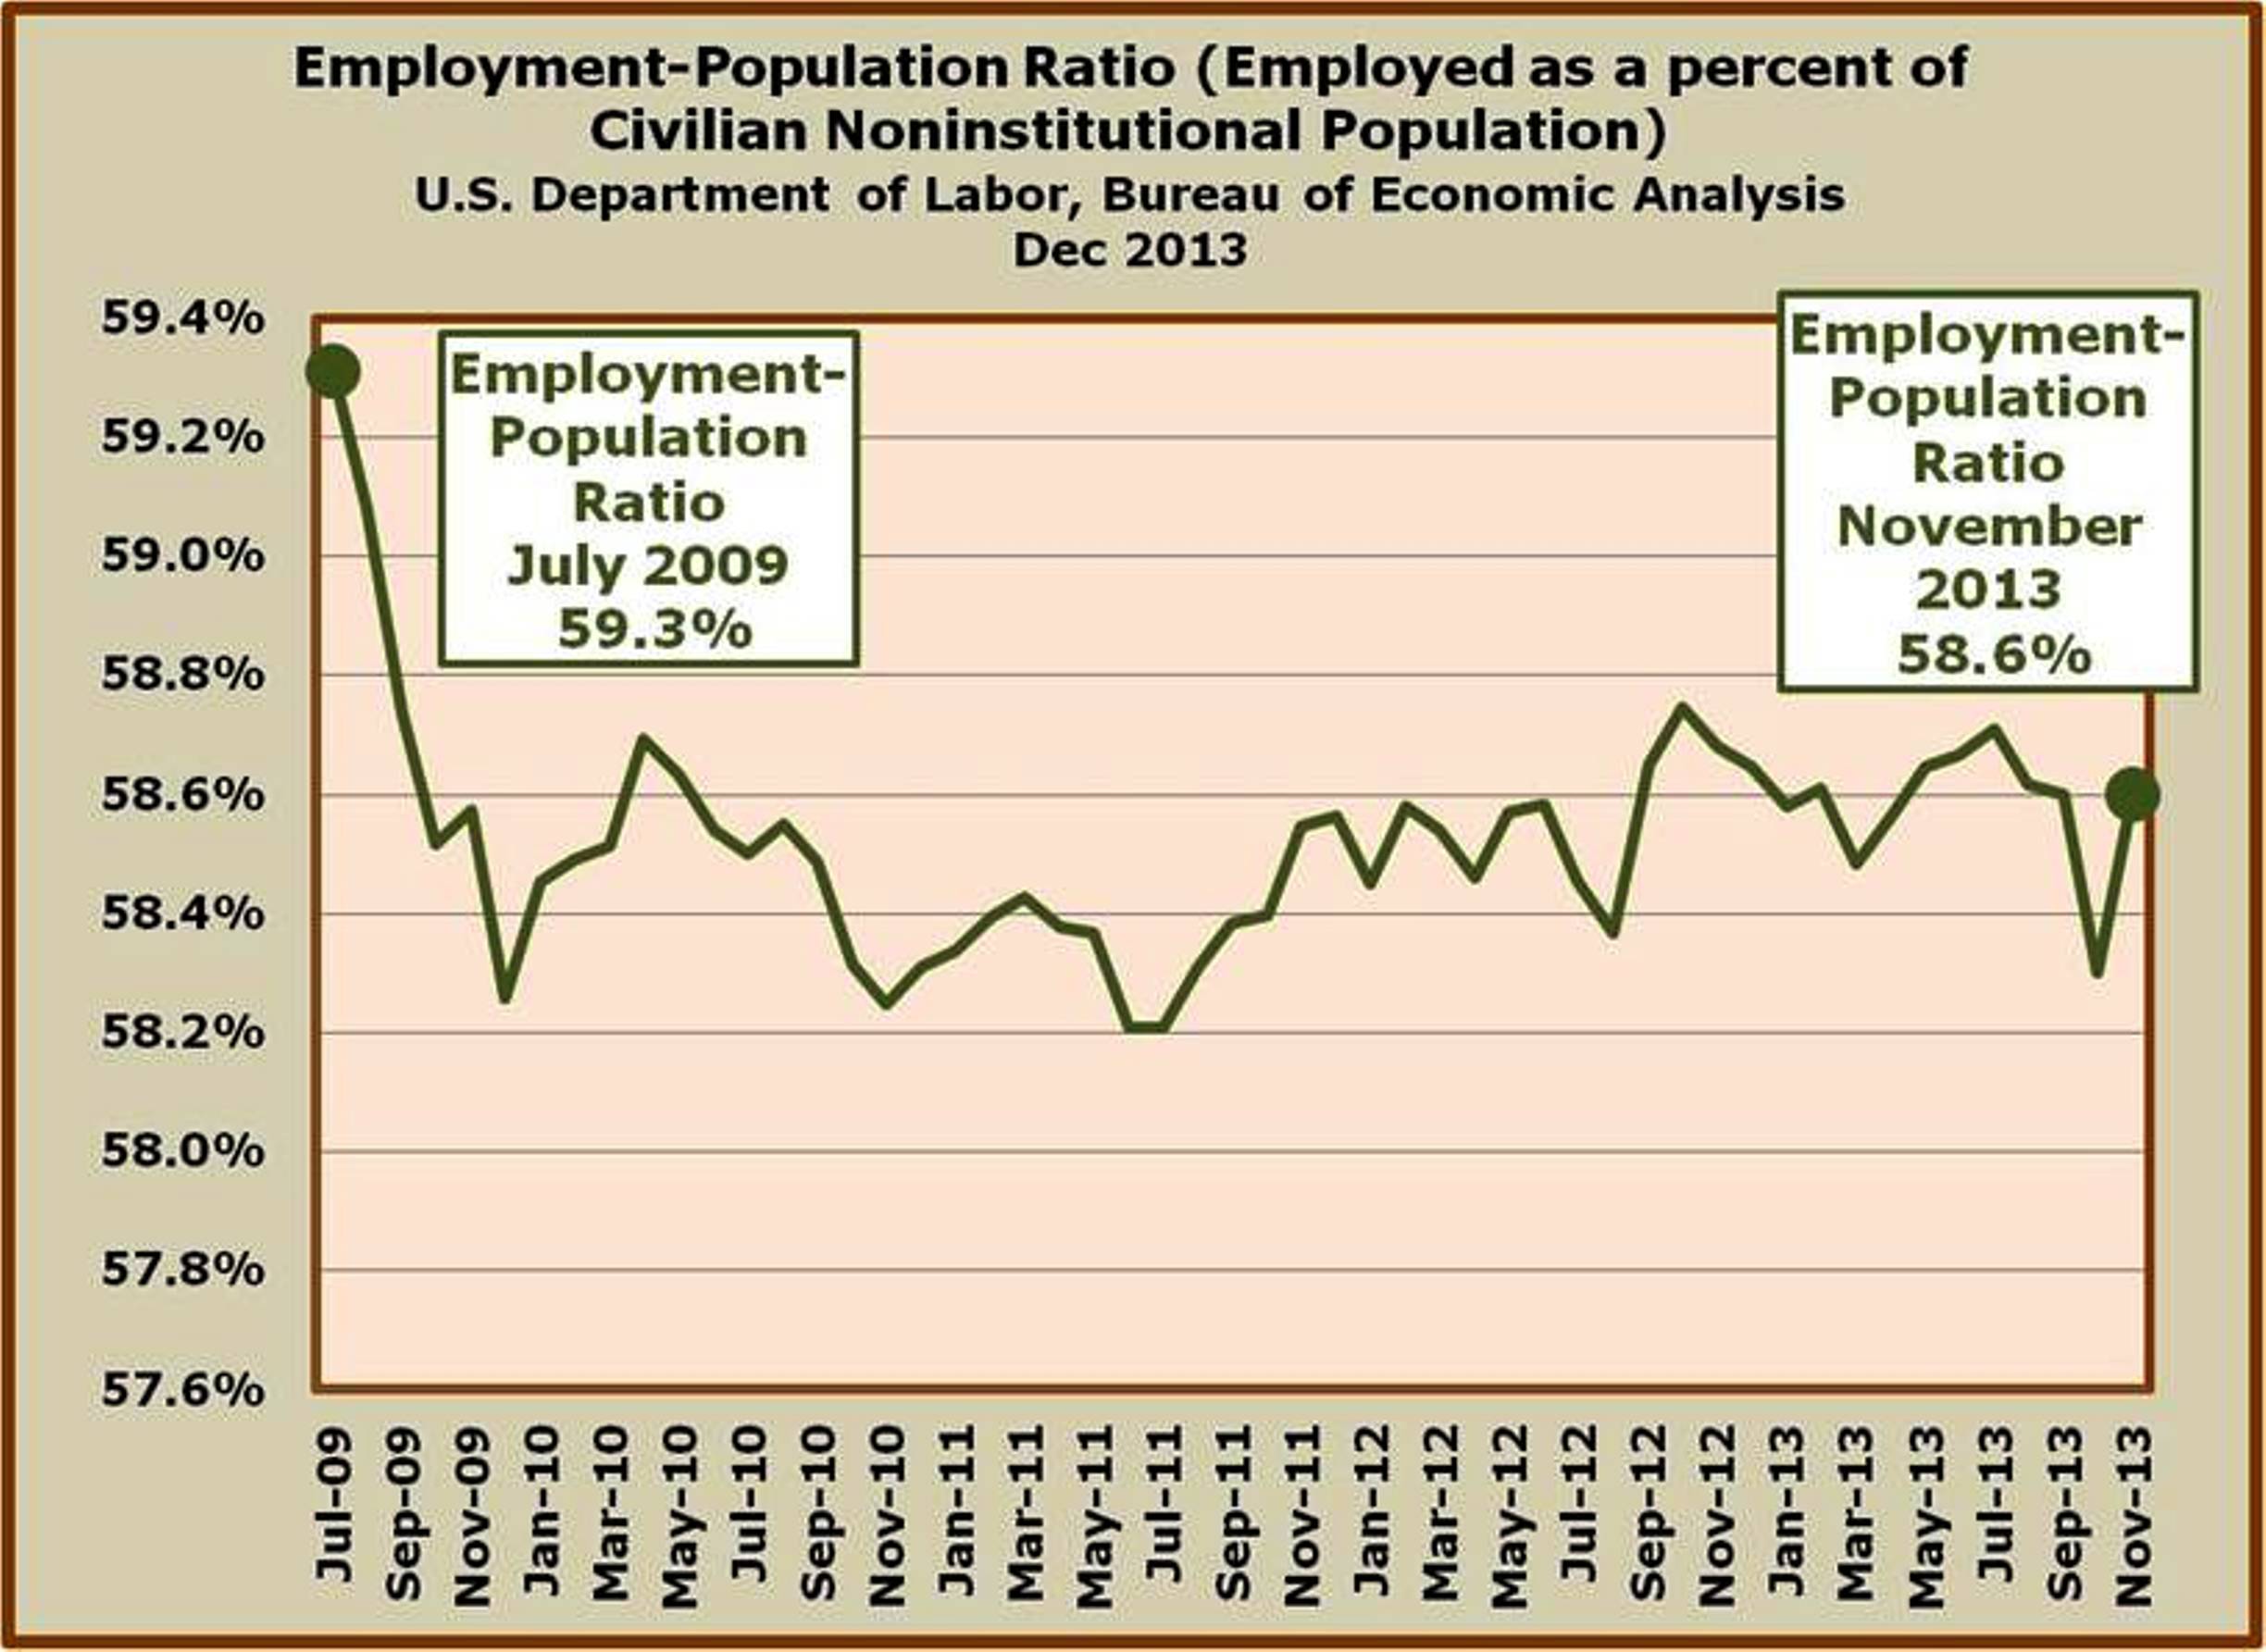
When the FED instituted the succession of Quantitative Easings and interest rates began to fall, it put upward pressure on the market prices of assets, if at times, only to offset the downward pressures being generated by other factors such as the recession, weak economic growth and the steady decline of the labor force participation rate as well as its companion metric, the employment population ratio.
Minutes of the Federal Open Market Committee
January 29–30, 2013
www.federalreserve.gov/monetarypolicy/files/fomcminutes20130130.pdf
(pp. 14-15)
“Consistent with its statutory mandate, the Federal Open Market Committee seeks monetary and financial conditions that will foster maximum employment and price stability In particular, the Committee seeks conditions in reserve markets consistent with federal funds trading in a range from 0 to ¼ percent. The Committee directs the Desk to undertake open market operations as necessary to maintain such conditions. The Desk is directed to continue purchasing longer-term Treasury securities at a pace of about $45 billion per month and to continue purchasing agency mortgage-backed securities at a pace of about $40 billion per month.”
…fast forward to October 2013
Minutes of the Federal Open Market Committee
www.federalreserve.gov/monetarypolicy/fomcminutes20131030.htm
“At the conclusion of the discussion, the Committee decided to continue adding policy accommodation by purchasing additional MBS at a pace of $40 billion per month and longer-term Treasury securities at a pace of $45 billion per month and to maintain its existing reinvestment policies. In addition, the Committee reaffirmed its intention to keep the target federal funds rate at 0 to 1/4 percent and retained its forward guidance that it anticipates that this exceptionally low range for the federal funds rate will be appropriate at least as long as the unemployment rate remains above 6-1/2 percent, inflation between one and two years ahead is projected to be no more than a half percentage point above the Committee's 2 percent longer-run goal, and longer-term inflation expectations continue to be well anchored.”
…and now December 2013
Press Release Dec 18, 2013
www.federalreserve.gov/newsevents/press/monetary/20131218a.htm
“Beginning in January, the Committee will add to its holdings of agency mortgage-backed securities at a pace of $35 billion per month rather than $40 billion per month, and will add to its holdings of longer-term Treasury securities at a pace of $40 billion per month rather than $45 billion per month.”
“The Committee also reaffirmed its expectation that the current exceptionally low target range for the federal funds rate of 0 to 1/4 percent will be appropriate at least as long as the unemployment rate remains above 6-1/2 percent, inflation between one and two years ahead is projected to be no more than a half percentage point above the Committee's 2 percent longer-run goal, and longer-term inflation expectations continue to be well anchored. In determining how long to maintain a highly accommodative stance of monetary policy, the Committee will also consider other information, including additional measures of labor market conditions, indicators of inflation pressures and inflation expectations, and readings on financial developments.”
While this is a backing off of its purchases referred to as Quantitative Easing, it is only around a 12% reduction from its very high levels of its intervention in recent months (moving to $35 billion in MBS and $40 billion in Treasurys; versus $40 billion in MBS and $45 billion in Treasurys). When the housing crises of a few years back helped cause an economic slumping of economic activity, it was the FED’s switch to a policy of monetary constraint that resulted in rapidly rising interest rates. Adjustable rate mortgage payments along with the rapid rise of payments on teaser rate mortgages, the overrating of derivative securities based on those mortgages as well as some outright fraudulent lending practices, were the major causes of the housing crisis.
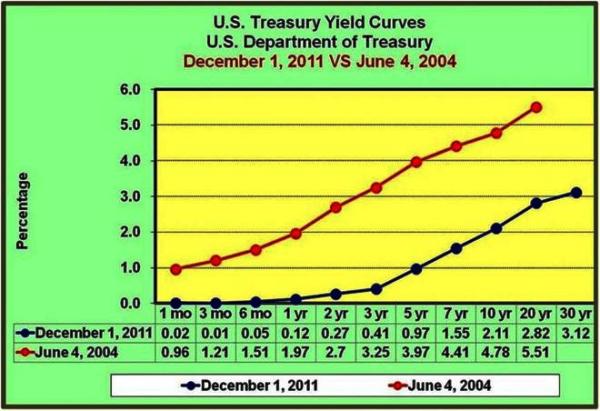
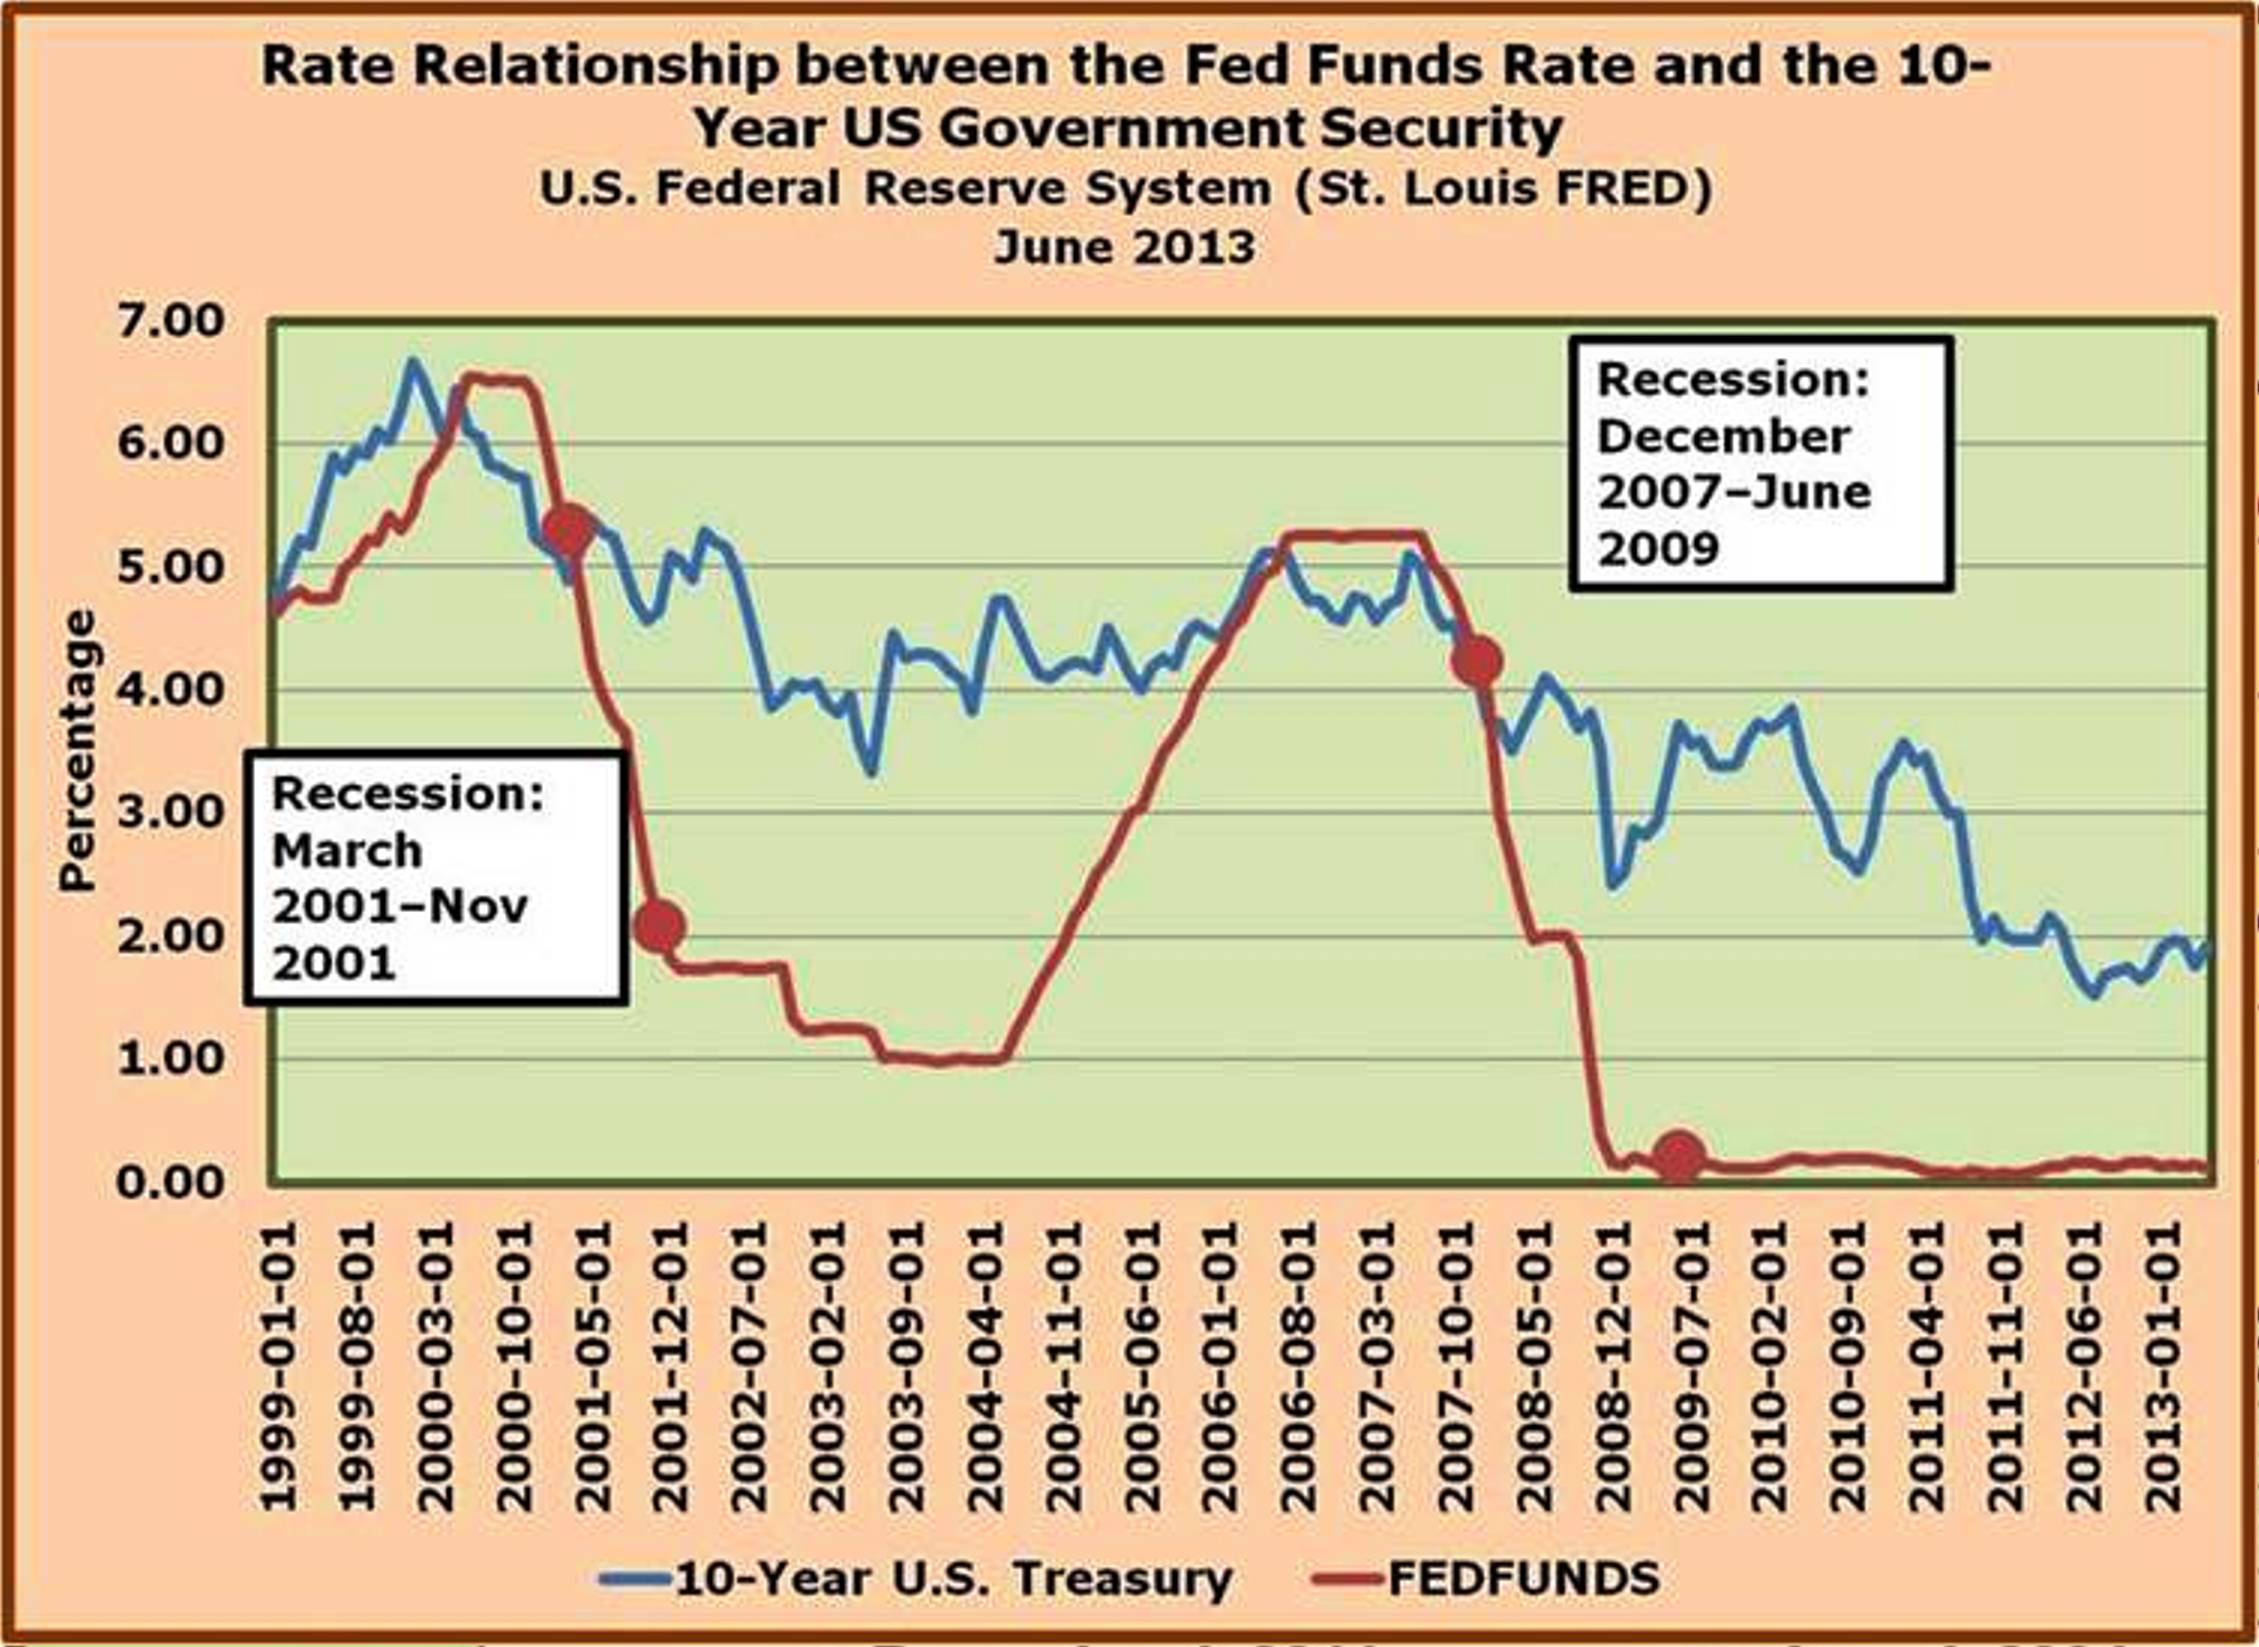
In summary, the FED drove up the targeted Fed Funds Rate from 1.0% in June 2004 to 5.25% by mid 2006. The hope was to drive up longer term rates, i.e., the 10-Year Treasury – this inability by the Fed to affect the interest rates on longer-term securities was (in)famously referred to by Alan Greenspan as a ‘conundrum’.
Again, the downside of the FED’s actions, was to put pressure on interest rates at the short end of the market, where such mortgage linked rates as the LIBOR – London Interbank Offer Rate [the scandal surrounding that is just now coming to light http://en.wikipedia.org/wiki/Libor_scandal], the 1-year Constant Maturity US Treasury Index, the CODI – Cost of Deposits Index, the COFI – Cost of Funds Index, etc., drove up adjustable (variable) rate mortgage payments.
Back to the current situation…
Despite a lackluster economy and the dampening effect that ‘Obamacare’ has placed on the economy, the stock market has hit new historical highs. Why? – You may ask. A major reason is the low yields on a major alternative form of investment: debt securities. The problem is that common stock has no maturity and hence significant interest rate risk. For those who have chased yield on debt securities and lengthened their maturities to do so, interest rate risk is also significant. In desperation, some of the severely underfunded pension funds have been chasing yield and have not only lengthened maturities but have also invested in riskier (usually called credit or default risk) assets where yields are higher because they include a large default risk premium. A significant rise in interest rates may trigger a crisis for such pension funds, similar to the mortgage crisis of several years ago.
An inclusive measure of interest rate risk on bonds is the duration of the investment. It includes both the time to maturity as well as the coupon rate. Duration increases as the time to maturity increases and increases as the coupon rate decreases. With positive coupon rates, duration will be less than the time to maturity and only on zero coupon bonds, also called pure discount bonds by some, will the duration of the security equal its’ time to maturity. A Treasury bill is an example of a zero coupon security. An irony of zero coupon rates is that while it decreases the reinvestment risk, it increases the price risk of the security.
Years ago, insurance companies pioneered the use of duration analysis. By juggling the portfolio until its duration equaled the period of time when the estimated cash outflow of benefits would be made, they minimized the interest rate risk. There was a movement by bank regulators of depository institutions to follow suit, but the mathematics can become very difficult. This movement seems to have slowed somewhat.
When banks became long-term lenders as the Commercial Loan Doctrine (it called for bank lending to be short term and self-liquidating) lost its grip on bank lending philosophy, it threw duration analysis to the winds, and in several cases, wreaked havoc on these institutions. These depository financial institutions rely heavily on short-term funds, e.g., checkable deposits and shorter-term time deposits to fund their lending. The push by regulators for higher capital ratios is a reflection of ignoring explicit management of assets along the lines of the duration principle.
The adoption of liability management and the occasional reliance on borrowed or purchased funds are symptoms of this problem.
The concept of duration also tells us something about stock and debt type investments. For those investments without contractually agreed to interest rates and no specified maturities, the relationship is much looser but interest rate risk is still present and significant.
Now let’s examine the minefield investors are in and how it has forced a moderate policy of moving very slowly away from the Quantitative Easing policies of the last few years.
Keeping your investments short-term, will lessen your interest rate risk both in terms of reinvestment risk and price risk the two components of interest rate risk. The loss of yield is the measure of the cost of hedging the interest rate risk. Investors chasing yield to partially compensate for the low interest rates, the result of the FED’s QE policy, will bear more price risk which increases the longer the holding period and the lower the interest rate. Investing in common stock also bears a substantial degree of interest rate risk even though its determination is less precise because of the uncertainty of the cash flow from dividends and the capital gain or loss from the stock’s sale as the holding period of the investment is so terminated. Refraining from investing in common stock results in a ‘cost’ owing to lower yields on short-term debt investments.
A rapid backing away from Quantitative Easing by the FED would trigger the explosion of the minefield in which investors find themselves currently. A sharp drop in the market prices of longer-term debt securities as well as common stock would negatively impact personal consumption expenditures, especially in the consumer durables segment of aggregate demand due to a wealth effect. Higher costs of capital will also impact aggregate demand by slowing the demand for business capital goods. Upward pressure on cap or capitalization rates for commercial property will have similar effects as would rising mortgage rates on the ongoing recovery in the housing market.
To put it bluntly, The FED has little choice but to back very slowly away from a policy of Quantitative Easing to avoid triggering financial disaster that is the minefield in which investors and the whole economy find themselves.
Happy New Year…2014
