
2014 Volume Issue 8
July 13, 2014
For a downloadable version, click the following:
July 13 Jellin with Yellen PDF
…a bit more compressed version of the PDF
JELLIN’ WITH YELLEN: The asymmetrical power of monetary policy
It is easy to criticize those who are supposed to be able to change economic behavior. Monetary policy making is no exception. Such authorities can and have made mistakes. But impotence in changing the economic behavior of a large economy is not the same thing as incompetence. This (2014) is a difficult time to assume the leadership of a central bank, especially that of the United States. Perhaps condolences are more in order for Dr. Yellen than are congratulations.
February 3, 2014 – Janet Yellen appointed new Federal Reserve Chair (four year term)
www.federalreserve.gov/aboutthefed/bios/board/yellen.htm
It is even worse when the nation’s economy continues in a slow to a negative growth pattern.
The Federal Reserve System’s (FED) power to alter the behavior of the economy in a weak period is virtually impotent as we have been experiencing and have seen on many occasions over the years. Massive open market purchases of various forms of debt securities in order to expand the monetary base have simply led to huge amounts of excess legal reserves.
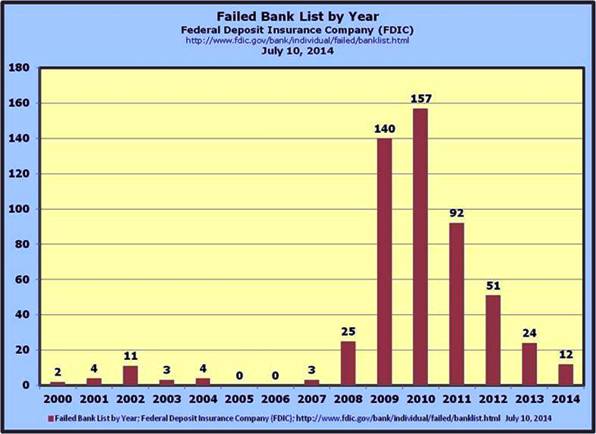
While the capacity for money and credit expansion has ballooned, the risk adjusted rates of return on credit creation activities by financial institutions is inadequate. Compounding the problem is the tendency for Congress and the regulatory agencies to tighten up credit standards when a major financial crisis such as the one beginning in 2007-2008 occurs. Closing the barn door after the horses have wandered off is a common occurrence when an economic malaise besets the economic and financial systems. A spike in delinquencies and defaults on debt securities can quickly elicit a cry for officials to press the panic button.
The depository institutions, especially the commercial banks can, if profitable, expand their credit creation activities by creating new checkable deposit money (in addition to the checkable deposits of depository institutions, the M-1 measure of money also includes currency in circulation, a large portion of which is held outside of the U.S.) and lending it out when they have excess capacity in the form of excess legal reserves.
UPDATE from FOMC Meeting March 19-20, 2013
- no change in policy from January meeting
www.econnewsletter.com/mar202013
From the NY Fed
www.econnewsletter.com/mar202013
“As of December 2007, currency in circulation—that is, U.S. coins and paper currency in the hands of the public—totaled about $829 billion dollars. The amount of cash in circulation has risen rapidly in recent decades and much of the increase has been caused by demand from abroad. The Federal Reserve estimates that the majority of the cash in circulation today is outside the United States.”
By some estimates, up to two-thirds of the currency in circulation is outside of the U.S.
Except in the Federal Funds market, as a depository institution system, they do not lend the excess out but rather utilize the larger legal reserve base to support the creation of additional checkable deposit money, which as it grows, increases the institutions’ required reserves. In effect, their excess reserves become required reserves should credit and the checkable deposit form of M-1 money expand. At the present time, one dollar of legal reserves can support a maximum of about $10 of M-1 money in the form of checkable deposits. This is a result of the fractional legal reserve structure.
As Thomas Humphrey points out in his “Essays On Inflation” published by the Federal Reserve Bank of Richmond a number of years ago, quantity theory critics of an earlier era referred to a reflux reaction that can set in when lending is not profitable, and the FED’s supply of additional legal reserves through open market operations, simply pile up as excess legal reserves to the depository institutions. The expanded capacity of depository institutions is not utilized as lending is not deemed profitable enough, especially when the risk premium is substantial as it is now and regulators have tightened up credit standards. The problem could also be coming from the demand side as potential borrowers back off when uncertainty is great. Think of this uncertainty as a determining the risk premium that increases the rate of discount firms use to determine the discounted present value of the net cash flows from a capital expenditure project.
“Tom Humphrey worked as an economist in the Research Department for 35 years. He retired from his position as senior economist and research advisor in 2005.
Humphrey published numerous journal articles and books during his career at the Richmond Fed. He continues to write on monetary policy history, most recently about the Federal Reserve's role as lender of last resort.”
www.richmondfed.org/research/economists/authors/humphrey
On the other hand, as we have seen on more than one occasion in the quarter century before the financial crisis of 2008, the FED has enormous power to slow an economy down. As we explained this asymmetrical power in previous newsletters on this web site, when the FED shrinks the monetary base by selling securities in the open market, a large part of the shrinkage comes in the legal reserves portion of the monetary base.
WHAT IS BEHIND THE FEDERAL RESERVE SYSTEM’S LATEST CAUTIONARY MONETARY POLICY ACTION?
January 2, 2014
www.econnewsletter.com/jan022014
“Once again, the asymmetry of the FED’s ability to alter economic behavior has manifested itself. While possessing enormous power to slow down the level of economic activity, it is, as the often used expression of ‘Pushing on a Limp String’ implies, nearly powerless to speed up the level of economic activity. The last six years or so, give more proof of the asymmetry in the power of the FED’s monetary policies to change the outcome of the economy’s behavior.”
As a result, depository institutions experience a reduction of their capacity to create checkable deposit money and lend it out. Given current legal reserve requirements, the multiple reduction in their money and credit creation capacity is about 10. In other words, a one dollar loss of legal reserves reduces the amount of checkable deposits that can be created and lent out by about $10. That is why the fear that the FED’s lengthy period of significant stimulus will turn into accelerating inflation is unfounded. The FED can also let the debt securities they hold mature and it would have the same effect, although much slower as selling them in the open market.
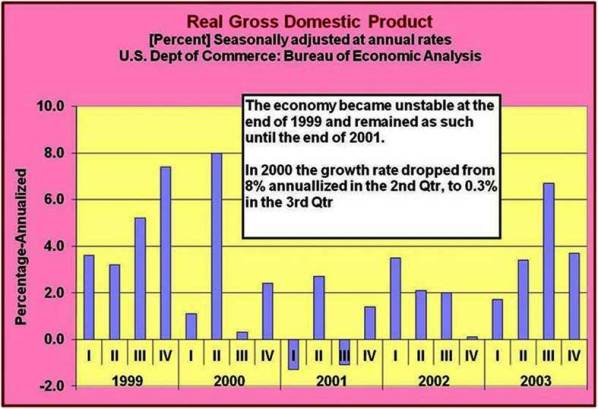
To a significant extent, but for different reasons, fiscal policy has manifested some of these asymmetrical characteristics. The large Federal Government deficits have done little to revive our moribund economy, just as they failed in the 1930’s contrary to the Myth surrounding the pump priming activities of FDR. On a few occasions in the past, such as during the two terms of William Clinton, his Treasury Secretaries convinced Congress to raise taxes to eliminate the federal budgetary deficit and if possible to reduce the outstanding federal debt. That policy was initially successful but as a result of the rapidly rising federal budgetary surpluses near the end of his last term, it triggered a fall in real GDP in 2000 which carried over into the first term of George Bush II.
Lies, Damned Lies, and Statistics
December 5, 2011
www.econnewsletter.com/dec052011
“The very large build up of federal government tax revenues as a result of significant tax increases during the Rubinomics* period of Clinton’s second term, led to a sharp collapse in GDP during 2000, President Clinton’s last year. This decline in the participation rates has biased downward the calculation in arriving at the unemployment rates.”
*(Rubinomics) Clinton Tax Hike 1999**
“When Clinton became President in 1993, he inherited an annual federal deficit of $290 billion (1992) and a U-3 unemployment rate of 7.5% (1992). In 1995, he appointed Robert Rubin as Secretary of the Treasury (http://en.wikipedia.org/wiki/Rubinomics). He and President Clinton lobbied Congress to dedicate the higher taxes legislated in 1993 toward reducing the federal deficit and they agreed with him.”
** The Clinton Tax Hike
www.heritage.org/research/reports/2008/03/tax-cuts-not-the-clinton-tax-hike-produced-the-1990s-boom
“In 1993, President Clinton ushered through Congress a large package of tax increases, which included the following:
- - An increase in the individual income tax rate to 36 percent and a 10 percent surcharge for the highest earners, thereby effectively creating a top rate of 39.6 percent.
- - Repeal of the income cap on Medicare taxes. This provision made the 2.9 percent Medicare payroll tax apply to all wage income. Like the Social Security payroll tax base today, the Medicare tax base was capped at a certain level of wage income prior to 1993.
- - A 4.3 cent per gallon increase in transportation fuel taxes.
- - An increase in the taxable portion of Social Security benefits.
- - A permanent extension of the phase-out of personal exemptions and the phase-down of the deduction for itemized expenses.
- - Raising the corporate income tax rate to 35 percent.
According to the original Treasury Department estimates, the Clinton tax hike was to raise federal revenues by 0.36 percent of gross domestic product (GDP) in its first year and by 0.83 percent of GDP in its fourth year, when all provisions were in effect and timing differences associated with near-term taxpayer behaviors had sorted themselves out. In 1997, the fourth-year effect would be roughly equivalent to an increase in the federal tax burden of about $114 billion.”
When pursuing stimulative policies, especially monetary policies, they are usually referred to pushing on a limp string as the monetary policy makers at the FED attempt to stimulate the economy when it is in a slow or negative pattern of real economic growth.
The early Keynesian literature referred to such things as liquidity traps and the need for negative interest rates to equate savings and investment (withdrawals and injections in the more general model). At least at the short term end of the yield curve we are close to zero interest rates.
On the other hand, policies of restraint, usually undertaken when the fear is an unacceptably high rate of inflation are more in the order of pulling on a steel rod. Failure to rein in such restrictive policies has often resulted in a dramatic slowing of real economic growth and even the onset of a recession, as we have experienced in the last few decades.
The Greenspan years witnessed a similar pattern resulting from monetary policy errors as did fiscal policy excesses as mentioned just above in the last term of President Clinton.
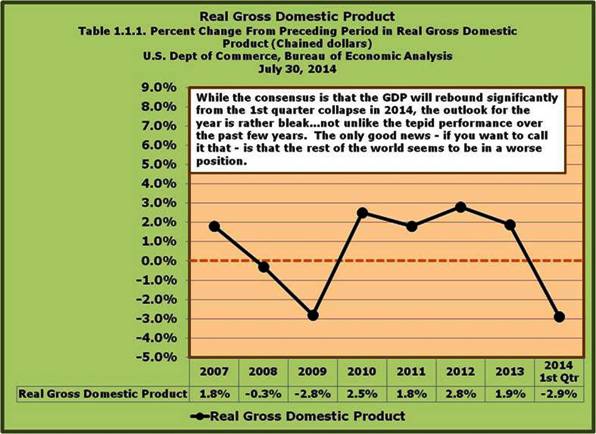
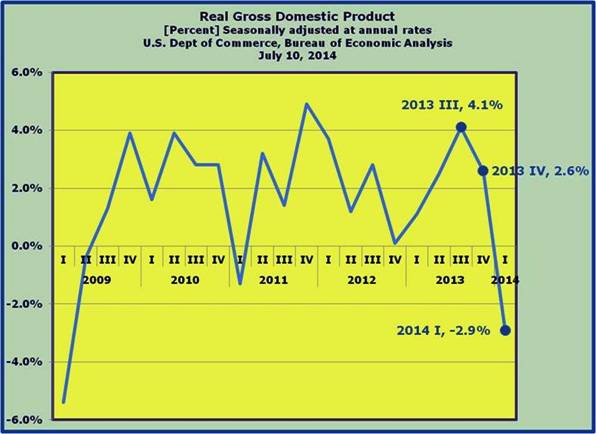
A number of recently released reports were shocking to some and apparently conveniently ignored by many. The wishful thinking by the many did not prevail over reality as these reports give testimony. Real GDP fell in the first quarter of 2014 from an anemic 2.6% in the fourth quarter of 2013 to a negative 2.9% in the third revision recently released.
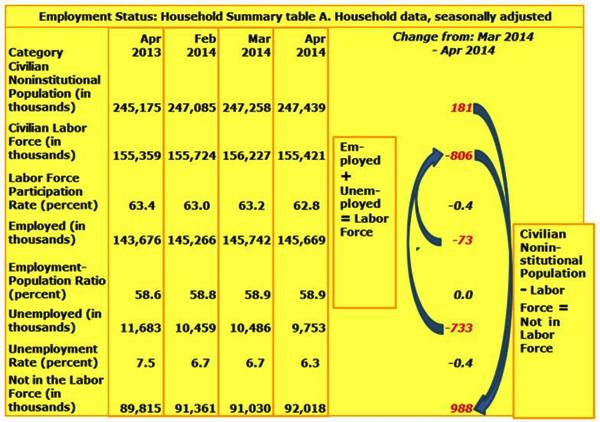
The jobs report released just prior to the most recent one, showed a further reduction in the Labor Force Participation Rate (LFPR) to 62.8% as well as an anemic Employment-Population Ratio of 58.9%. The most recent report showed little promise for any resurrection in the rate of economic growth.
http://www.bls.gov/news.release/archives/empsit_07032014.pdf
Economists for the World Bank have lowered their estimates for the World’s economic growth rate as well as for several large economies in the developing nations’ category.
“World Bank Cuts 2014 Global Growth Estimate to 2.8% From 3.2%”
The FED has also lowered its forecast of the U.S. economic growth rate.
“The nation’s central bank lowered its forecast for growth this year to between 2.1 percent and 2.3 percent, down from its previous prediction of nearly 3 percent.”
While the numbers used will no doubt need to be updated, Okun’s Law comes to mind. We are not growing sufficiently to improve the labor market, in particular. A recent discussion with an executive head hunter revealed the current economic malaise in which we are mired. He indicated that in contrast to the situation prior to the financial crisis surfacing in 2007t where the number of qualified candidates for a position numbered two or three, employers can currently select one from a pool of twenty or thirty qualified candidates. Many positions have been filled by over-qualified persons eager to find employment. While this is anecdotal, it is far from uncommon.
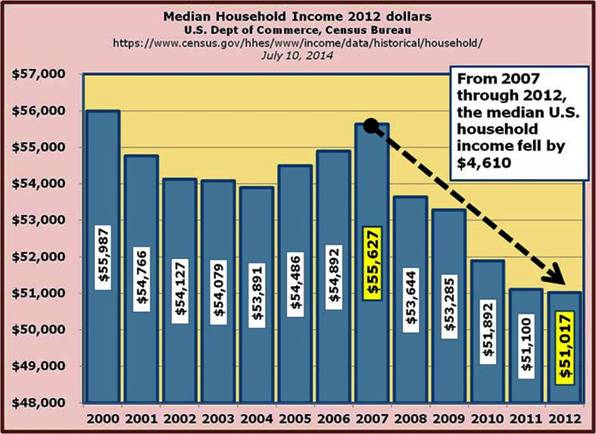
The emphasis on income redistribution has been very harmful to the economic growth rate and to the income distribution. The lower and middle income groups have sufferer contrary to the desires of the wishful thinkers. The medium income has fallen significantly.
As was shown in our last newsletter in June 2014, focusing on the labor market, the continued fall in nearly all of the population cohorts’ Labor Force Participation Rates (LFPRs) and Employment to Population Ratios (EPRs) bodes even further problems. Contrary to the wishful thinkers, the fall in the LFPRs and the EPRs was not due primarily to retiring baby boomers The LFPR in that age cohort 65 years of age and older had actually risen from 17.4% in January 2009 to 18.6% in April 2014.
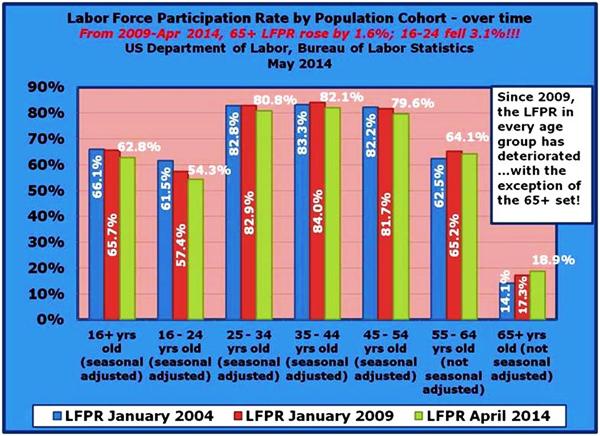
Changes in the Employment Picture by Age Group:
So much for the Assertion that the Fall-off was primarily due to the Baby-Boomers rolling past age 65
June 20, 2014
www.econnewsletter.com/jun202014
“It’s easy to see how many people have arrived at the conclusion that the decline in the Labor Force Participation Rate (LFPR) is primarily an issue associated with an aging population. In fact, there were about 5 million people added to the roles of the ‘not in the labor force’ for this age group(65+ year olds). If you simply added 5 million back into the current labor force, this would raise the Labor Force Participation Rate up to 64.8% a full two percentage points higher than where it is currently at (62.8% in April and May 2014). So the question becomes this: since so many people are leaving the labor force in the oldest age group, why haven’t the other cohorts picked up the slack? If the 16 through 64 age groups had merely returned to the January 2009 levels, this would have bumped up the labor force by nearly 4.2 million people and moving the LFPR to the 64.5% level.”
It is in the younger age groups that have been showing a persistent decline in these two metrics.
The April Employment Situation Report showed an improvement in the U-3 measure of unemployment but it was all due to many thousands of able bodied workers, heading for the sidelines and dropping out of the labor force or not even entering it as they reached the age of 16. Most of these dropouts are referred to as discouraged workers and because they are not actively seeking employment; they, by the definition of the U-3 measure of unemployment, are treated as not being in the labor force. Most of this huge category of people is discouraged due to the odds against finding a job. It conjures up memories of the 1930s. As pilots well know, stalling can occur when a planes speed is less than sufficient to overcome the force of gravity. The macroeconomy is flirting with an analogous problem.
The latest Employment Situation Report reinforced the bad news.
http://www.bls.gov/news.release/archives/empsit_07032014.pdf
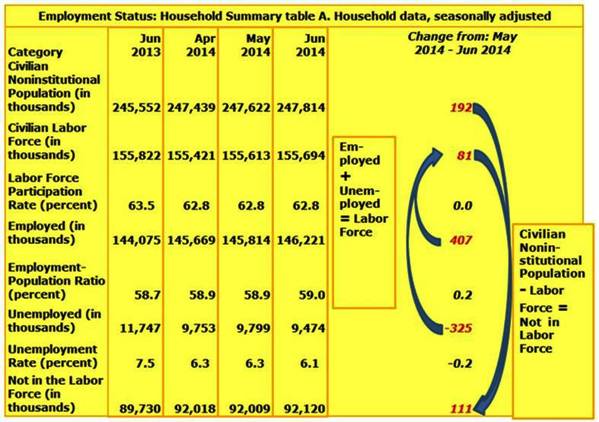
The good news was that the unemployed fell by 325,000 and the employed rose by 407,000. The bad news was that the Labor Force only expanded by 81,000, while the Civilian Noninstitutional Population rose by 192,000. This resulted in a marginal Labor Force Participation (LFPR) for the month of June of 42.2%. No, the LFPR did not register a significant enough drop to reduce the rate, but it did move from 62.84% in May 2014 to 62.83% in June 2014.
As mentioned above, the median income of households has fallen dramatically over the past several years from $55,627 in 2007 to $51,017 in 2012.
The FED has done its best but to no avail. It has driven down interest rates to very low levels. Some Austrian school economists have argued that this should bring about a spending boom, but if it is occurring, it is fully camouflaged, so much so that it is invisible.
One former presidential candidate has even been beating the drum for a return to the gold standard. A thorough study of various forms of the gold standard over the years, does not give credence to such a faith in its ability to give us reasonable economic growth without an undesirably high inflationary rates.
Only A New Gold Standard Will Save The U.S. Dollar - Steve Forbes
www.forbes.com/fdc/welcome_mjx.shtml
“Just as scales measure weight, money should measure value and it does that best when it has a fixed value,”
he said. “Nothing else works.”
In its best years, it came to an end when some nations felt they needed to take back their monetary sovereignty and left the system. Since the U.S version under FDR, the U.S. never tied the money stock to the gold stock; it was not really a true gold standard. When Gold began to flow out, it was effectively abandoned. The IMF Bretton Woods fixed exchange rate system after WWII was linked to gold via the U.S. Dollar, but frequent and significant devaluations and revaluations made it more of a floating rate system than a true gold standard.
THE CURRENT CACOPHONY OF MONETARY POLICIES THROUGHOUT THE MAJOR NATIONS
July 4, 2013
www.econnewsletter.com/jul042013
“History shows that whenever a nation faces serious problems, such as winning a war or running out of international reserves (part of which is gold), or continuing domestic policies that seem incompatible with other nations’ goals, the often restrictive fixed exchange rate systems (including a single currency system such as that based on the Euro) have frequently led to abandonment of such standards. This has been the case EVEN IF THERE WAS A GOLD STANDARD! The U.S. did so under the ‘watered down gold standard’ brought back by FDR. Over the years, even the link of the gold backing to the currency portion of M-1 money was gradually reduced. After WWII when the U.S. sponsored a form of a gold exchange standard referred to as the Bretton Woods IMF Fixed Exchange Rate System and when the U.S. began to experience significant balance of payments deficits, the gold price of the Dollar was altered (increased, i.e., the Dollar was devalued which is a form of depreciation in respect to gold) to avoid austerity policies to eliminate those deficits causing the outflow of gold.”
As the European Union is now experiencing, giving up sovereignty including monetary sovereignty is politically risky for most nations.
Over one year ago as a member of the Federal Open Market Committee (FOMC) being the then President of the Federal Reserve Bank of san Francisco, Dr. Yellen, the recently appointed Chair of the Federal Reserve Board of Governors, had warned against unfounded optimism and a premature reversing of the FED’s relatively long period of Quantitative Easing. Her comments were reported in the minutes of the Federal Open Market Committee that occurred back then.
Recently, she expressed a similar view. She is not alone in this regard. The Central Bank of the European Union made it clear that it will continue a policy of monetary stimulus. Authorities in India, China, and Japan also reflect similar views.
The residential housing market in the U.S. continues as one of the sources of economic lethargy despite lower interest rates on mortgages. It seems that very few homeowners want to sell. A combination of an uncertain economic outlook and being underwater and facing a significant loss if they sell, are major causes of this unwillingness by homeowners. Builders are finding that it is difficult to finance the building of new homes even though there seem to be a reasonable numbers of potential buyers.
The reappearance of sub-prime mortgage financing causes a good deal of uneasiness to many and a growing fear that the grounds for anther residential housing crises is beginning to build up. This fear is exacerbated by talk of easing lending standards. There are other sources of economic concern that we will examine in future newsletters. It is as the oriental expression goes a case of “death by a thousand cuts.”
As we have explained several times in these newsletters, the FED’s monetary policies are very weak in re-staring a stalled economy. “Pushing on a limp string” is a phrase often used to describe the FED’s inability to jump start a stalled economy. On the other hand the FED has awesome power to slow down an economy that is expanding. That is why Dr. Yellen has warned against a premature end to Quantitative Easing policies.
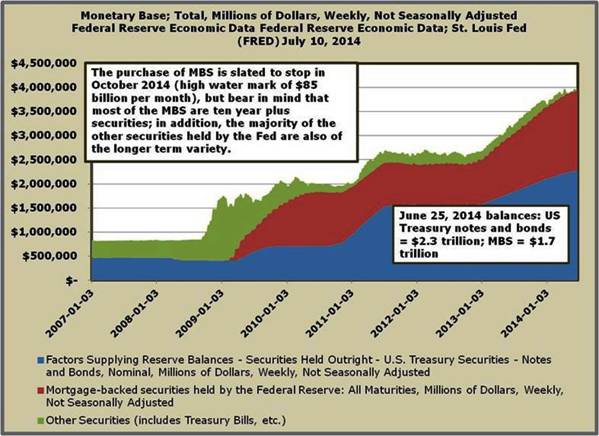
Many have expressed fears that the FED’s policies have added tremendously to the FED’s portfolio of financial assets and to the monetary base of the financial system. Recall that the monetary base is the sum of the legal reserves of the depository system (commercial banks and the former called thrift institutions, what is left of the savings and loan associations, savings banks and credit unions) plus the currency in circulation. As mentioned earlier in this article, the lack of economic growth has resulted in hordes of free or un-borrowed excess reserves in the system. The fear that it could suddenly lead to a rapid rate of economic growth financed by rapid growth in credit and causing a serious rise in the inflation rate is somewhat unfounded since the Fed could eliminate the excess reserves by raising legal reserve ratios as they have done s in the past or by selling off these recently acquired assets thus reducing the money and credit creation potential of the depository institutions. The result would be a sharp rise in interest rates to a more “normal” long-term average.
If reasonable economic growth rate absent serious inflation returns, they could also shrink tier portfolio and the monetary base more gradually by letting these assets in their portfolio mature since nearly all of these assets are of the debt rather than equity variety.
A positive result from this accumulation of assets in the FED’s portfolio is that that they include a large range of maturities from the very short tem to the relatively long term. For the first time in many years the FED can impact the entire rang of the yield curve and not just the short term end. Recall that the FED’s concentration of its marketable assets in the short- term maturity range was the cause of Chairman Greenspan’s conundrum expression. The FED could overpower the short-term end of the debt market but the public’s expectations of future short-interest rates dominated the intermediate and long-term portions of the market and its yield curve.
Dr. Yellen, our best wishes to your success as Chair of the Board of Governors of the Federal Reserve System.
